HSBC 2008 Annual Report Download - page 252
Download and view the complete annual report
Please find page 252 of the 2008 HSBC annual report below. You can navigate through the pages in the report by either clicking on the pages listed below, or by using the keyword search tool below to find specific information within the annual report.-
 1
1 -
2
-
3
-
4
-
5
-
6
-
7
-
8
-
9
-
10
-
11
-
12
-
13
-
14
-
15
-
16
-
17
-
18
-
19
-
20
-
21
-
22
-
23
-
24
-
25
-
26
-
27
-
28
-
29
-
30
-
31
-
32
-
33
-
34
-
35
-
36
-
37
-
38
-
39
-
40
-
41
-
42
-
43
-
44
-
45
-
46
-
47
-
48
-
49
-
50
-
51
-
52
-
53
-
54
-
55
-
56
-
57
-
58
-
59
-
60
-
61
-
62
-
63
-
64
-
65
-
66
-
67
-
68
-
69
-
70
-
71
-
72
-
73
-
74
-
75
-
76
-
77
-
78
-
79
-
80
-
81
-
82
-
83
-
84
-
85
-
86
-
87
-
88
-
89
-
90
-
91
-
92
-
93
-
94
-
95
-
96
-
97
-
98
-
99
-
100
-
101
-
102
-
103
-
104
-
105
-
106
-
107
-
108
-
109
-
110
-
111
-
112
-
113
-
114
-
115
-
116
-
117
-
118
-
119
-
120
-
121
-
122
-
123
-
124
-
125
-
126
-
127
-
128
-
129
-
130
-
131
-
132
-
133
-
134
-
135
-
136
-
137
-
138
-
139
-
140
-
141
-
142
-
143
-
144
-
145
-
146
-
147
-
148
-
149
-
150
-
151
-
152
-
153
-
154
-
155
-
156
-
157
-
158
-
159
-
160
-
161
-
162
-
163
-
164
-
165
-
166
-
167
-
168
-
169
-
170
-
171
-
172
-
173
-
174
-
175
-
176
-
177
-
178
-
179
-
180
-
181
-
182
-
183
-
184
-
185
-
186
-
187
-
188
-
189
-
190
-
191
-
192
-
193
-
194
-
195
-
196
-
197
-
198
-
199
-
200
-
201
-
202
-
203
-
204
-
205
-
206
-
207
-
208
-
209
-
210
-
211
-
212
-
213
-
214
-
215
-
216
-
217
-
218
-
219
-
220
-
221
-
222
-
223
-
224
-
225
-
226
-
227
-
228
-
229
-
230
-
231
-
232
-
233
-
234
-
235
-
236
-
237
-
238
-
239
-
240
-
241
-
 242
242 -
 243
243 -
 244
244 -
 245
245 -
 246
246 -
 247
247 -
 248
248 -
 249
249 -
 250
250 -
 251
251 -
 252
252 -
 253
253 -
 254
254 -
 255
255 -
 256
256 -
 257
257 -
 258
258 -
 259
259 -
 260
260 -
 261
261 -
 262
262 -
263
-
264
-
265
-
266
-
267
-
268
-
269
-
270
-
271
-
272
-
273
-
274
-
275
-
276
-
277
-
278
-
279
-
280
-
281
-
282
-
283
-
284
-
285
-
286
-
287
-
288
-
289
-
290
-
291
-
292
-
293
-
294
-
295
-
296
-
297
-
298
-
299
-
300
-
301
-
302
-
303
-
304
-
305
-
306
-
307
-
308
-
309
-
310
-
311
-
312
-
313
-
314
-
315
-
316
-
317
-
318
-
319
-
320
-
321
-
322
-
323
-
324
-
325
-
326
-
327
-
328
-
329
-
330
-
331
-
332
-
333
-
334
-
335
-
336
-
337
-
338
-
339
-
340
-
341
-
342
-
343
-
344
-
345
-
346
-
347
-
348
-
349
-
350
-
351
-
352
-
353
-
354
-
355
-
356
-
357
-
358
-
359
-
360
-
361
-
362
-
363
-
364
-
365
-
366
-
367
-
368
-
369
-
370
-
371
-
372
-
373
-
374
-
375
-
376
-
377
-
378
-
379
-
380
-
381
-
382
-
383
-
384
-
385
-
386
-
387
-
388
-
389
-
390
-
391
-
392
-
393
-
394
-
395
-
396
-
397
-
398
-
399
-
400
-
401
-
402
-
403
-
404
-
405
-
406
-
407
-
408
-
409
-
410
-
411
-
412
-
413
-
414
-
415
-
416
-
417
-
418
-
419
-
420
-
421
-
422
-
423
-
424
-
425
-
426
-
427
-
428
-
429
-
430
-
431
-
432
-
433
-
434
-
435
-
436
-
437
-
438
-
439
-
440
-
441
-
442
-
443
-
444
-
445
-
446
-
447
-
448
-
449
-
450
-
451
-
452
-
453
-
454
-
455
-
456
-
457
-
458
-
459
-
460
-
461
-
462
-
463
-
464
-
465
-
466
-
467
-
468
-
469
-
470
-
471
-
472
 |
 |

HSBC HOLDINGS PLC
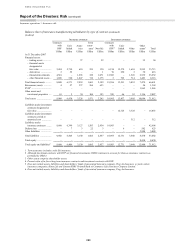
Report of the Directors: Risk (continued)
Market risk > HSBC Holdings > Interest repricing gap / VAR
250
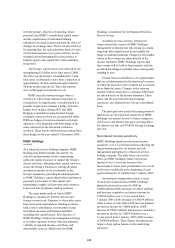
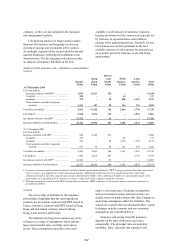
Instead of assuming that all interest rates move
together, HSBC groups its interest rate exposures
into currency blocs whose interest rates are
considered likely to move together. The sensitivity
of projected net interest income, on this basis, is
described as follows:
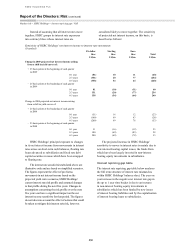
Sensitivity of HSBC Holdings’ net interest income to interest rate movements
(Unaudited)
US dollar
bloc
Sterling
bloc
Euro
bloc
Total
US$m US$m US$m US$m
Change in 2009 projected net interest income arising
from a shift in yield curves of:
+ 25 basis points at the beginning of each quarter
in 2009
0-1 year (81) 10 11 (60)
2-3 years (351) 20 77 (254)
4-5 years (358) 54 64 (240)
– 25 basis points at the beginning of each quarter
in 2009
0-1 year 81 (10) (11) 60
2-3 years 351 (20) (77) 254
4-5 years 358 (54) (64) 240
Change in 2008 projected net interest income arising
from a shift in yield curves of:
+ 25 basis points at the beginning of each quarter
in 2008
0-1 year (51) 16 12 (23)
2-3 years (180) 69 83 (28)
4-5 years (200) 69 78 (53)
– 25 basis points at the beginning of each quarter
in 2008
0-1 year 51 (16) (12) 23
2-3 years 180 (69) (83) 28
4-5 years 200 (69) (78) 53
HSBC Holdings’ principal exposure to changes
in its net interest income from movements in interest
rates arises on short-term cash balances, floating rate
loans advanced to subsidiaries and fixed rate debt
capital securities in issue which have been swapped
to floating rate.
The interest rate sensitivities tabulated above are
illustrative only and are based on simplified scenarios.
The figures represent the effect of pro forma
movements in net interest income based on the
projected yield curve scenarios, HSBC Holdings’
current interest rate risk profile and assumed changes
to that profile during the next five years. Changes to
assumptions concerning the risk profile over the next
five years can have a significant impact on the net
interest income sensitivity for that period. The figures
do not take into account the effect of actions that could
be taken to mitigate this interest rate risk, however.
The projected increase in HSBC Holdings’
sensitivity to moves in interest rates is mainly due to
new interest-bearing capital issues, the funds from
which have been largely invested in non-interest
bearing equity investments in subsidiaries.
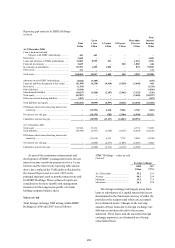
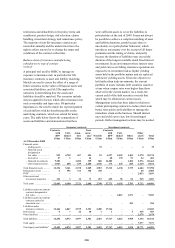
Interest repricing gap table
The interest rate repricing gap table below analyses
the full term structure of interest rate mismatches
within HSBC Holdings’ balance sheet. The year on
year increase in the negative net interest rate gap in
the up to 1 year time bucket is due to an increase
in non-interest bearing equity investments in
subsidiaries which has been funded by new issues
of interest bearing liabilities and by the capitalisation
of interest bearing loans to subsidiaries.