HSBC 2008 Annual Report Download - page 110
Download and view the complete annual report
Please find page 110 of the 2008 HSBC annual report below. You can navigate through the pages in the report by either clicking on the pages listed below, or by using the keyword search tool below to find specific information within the annual report.-
 1
1 -
2
-
3
-
4
-
5
-
6
-
7
-
8
-
9
-
10
-
11
-
12
-
13
-
14
-
15
-
16
-
17
-
18
-
19
-
20
-
21
-
22
-
23
-
24
-
25
-
26
-
27
-
28
-
29
-
30
-
31
-
32
-
33
-
34
-
35
-
36
-
37
-
38
-
39
-
40
-
41
-
42
-
43
-
44
-
45
-
46
-
47
-
48
-
49
-
50
-
51
-
52
-
53
-
54
-
55
-
56
-
57
-
58
-
59
-
60
-
61
-
62
-
63
-
64
-
65
-
66
-
67
-
68
-
69
-
70
-
71
-
72
-
73
-
74
-
75
-
76
-
77
-
78
-
79
-
80
-
81
-
82
-
83
-
84
-
85
-
86
-
87
-
88
-
89
-
90
-
91
-
92
-
93
-
94
-
95
-
96
-
97
-
98
-
99
-
 100
100 -
 101
101 -
 102
102 -
 103
103 -
 104
104 -
 105
105 -
 106
106 -
 107
107 -
 108
108 -
 109
109 -
 110
110 -
 111
111 -
 112
112 -
 113
113 -
 114
114 -
 115
115 -
 116
116 -
 117
117 -
 118
118 -
 119
119 -
 120
120 -
121
-
122
-
123
-
124
-
125
-
126
-
127
-
128
-
129
-
130
-
131
-
132
-
133
-
134
-
135
-
136
-
137
-
138
-
139
-
140
-
141
-
142
-
143
-
144
-
145
-
146
-
147
-
148
-
149
-
150
-
151
-
152
-
153
-
154
-
155
-
156
-
157
-
158
-
159
-
160
-
161
-
162
-
163
-
164
-
165
-
166
-
167
-
168
-
169
-
170
-
171
-
172
-
173
-
174
-
175
-
176
-
177
-
178
-
179
-
180
-
181
-
182
-
183
-
184
-
185
-
186
-
187
-
188
-
189
-
190
-
191
-
192
-
193
-
194
-
195
-
196
-
197
-
198
-
199
-
200
-
201
-
202
-
203
-
204
-
205
-
206
-
207
-
208
-
209
-
210
-
211
-
212
-
213
-
214
-
215
-
216
-
217
-
218
-
219
-
220
-
221
-
222
-
223
-
224
-
225
-
226
-
227
-
228
-
229
-
230
-
231
-
232
-
233
-
234
-
235
-
236
-
237
-
238
-
239
-
240
-
241
-
242
-
243
-
244
-
245
-
246
-
247
-
248
-
249
-
250
-
251
-
252
-
253
-
254
-
255
-
256
-
257
-
258
-
259
-
260
-
261
-
262
-
263
-
264
-
265
-
266
-
267
-
268
-
269
-
270
-
271
-
272
-
273
-
274
-
275
-
276
-
277
-
278
-
279
-
280
-
281
-
282
-
283
-
284
-
285
-
286
-
287
-
288
-
289
-
290
-
291
-
292
-
293
-
294
-
295
-
296
-
297
-
298
-
299
-
300
-
301
-
302
-
303
-
304
-
305
-
306
-
307
-
308
-
309
-
310
-
311
-
312
-
313
-
314
-
315
-
316
-
317
-
318
-
319
-
320
-
321
-
322
-
323
-
324
-
325
-
326
-
327
-
328
-
329
-
330
-
331
-
332
-
333
-
334
-
335
-
336
-
337
-
338
-
339
-
340
-
341
-
342
-
343
-
344
-
345
-
346
-
347
-
348
-
349
-
350
-
351
-
352
-
353
-
354
-
355
-
356
-
357
-
358
-
359
-
360
-
361
-
362
-
363
-
364
-
365
-
366
-
367
-
368
-
369
-
370
-
371
-
372
-
373
-
374
-
375
-
376
-
377
-
378
-
379
-
380
-
381
-
382
-
383
-
384
-
385
-
386
-
387
-
388
-
389
-
390
-
391
-
392
-
393
-
394
-
395
-
396
-
397
-
398
-
399
-
400
-
401
-
402
-
403
-
404
-
405
-
406
-
407
-
408
-
409
-
410
-
411
-
412
-
413
-
414
-
415
-
416
-
417
-
418
-
419
-
420
-
421
-
422
-
423
-
424
-
425
-
426
-
427
-
428
-
429
-
430
-
431
-
432
-
433
-
434
-
435
-
436
-
437
-
438
-
439
-
440
-
441
-
442
-
443
-
444
-
445
-
446
-
447
-
448
-
449
-
450
-
451
-
452
-
453
-
454
-
455
-
456
-
457
-
458
-
459
-
460
-
461
-
462
-
463
-
464
-
465
-
466
-
467
-
468
-
469
-
470
-
471
-
472
 |
 |

HSBC HOLDINGS PLC
Report of the Directors: Operating and Financial Review (continued)
Geographical regions > Rest of Asia-Pacific > 2008
108
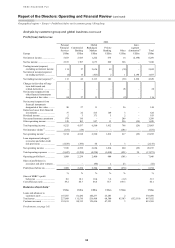
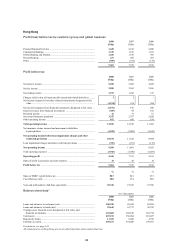
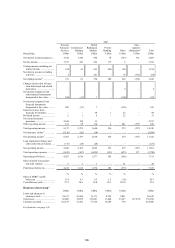
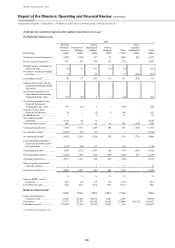
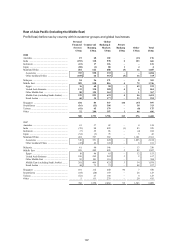
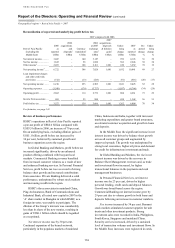
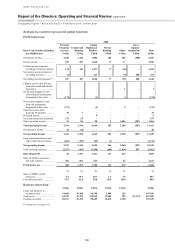
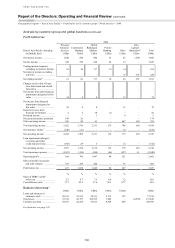
Profit/(loss) before tax by country within customer groups and global businesses (continued)
Personal
Financial
Services
US$m
Commercial
Banking
US$m
Global
Banking &
Markets
US$m
Private
Banking
US$m
Other
US$m
Total
US$m
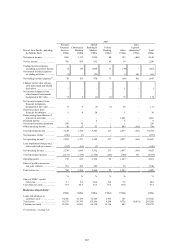
2006
Australia ............................................................ 76 32 46 – – 154
India .................................................................. (24) 46 277 2 92 393
Indonesia ........................................................... (22) 46 69 – (22) 71
Japan ................................................................. (3) (2) 49 (1) 80 123
Mainland China ................................................ 276 241 167 – 24 708
Associates ..................................................... 274 210 86 – 5 575
Other mainland China .................................. 2 31 81 – 19 133
Malaysia ............................................................ 77 87 99 (1) 12 274
Middle East ....................................................... 235 356 396 2 46 1,035
Egypt ............................................................ 9 41 41 – 20 111
United Arab Emirates ................................... 70 209 145 3 (2) 425
Other Middle East ........................................ 59 67 70 (1) (1) 194
Middle East (excluding Saudi Arabia) ......... 138 317 256 2 17 730
Saudi Arabia ................................................. 97 39 140 – 29 305
Singapore .......................................................... 73 90 145 68 (11) 365
South Korea ...................................................... (55) (20) 115 – 19 59
Taiwan .............................................................. (179) 37 118 – 1 (23)
Other ................................................................. 23 121 168 10 46 368
477 1,034 1,649 80 287 3,527
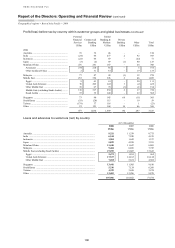
Loans and advances to customers (net) by country
At 31 December
2008
US$m
2007
US$m
2006
US$m
Australia ........................................................................................................... 9,321 11,339 8,775
India ................................................................................................................. 6,244 7,220 4,915
Indonesia .......................................................................................................... 1,904 1,642 1,337
Japan ................................................................................................................ 5,839 4,258 3,391
Mainland China ............................................................................................... 11,440 11,647 6,065
Malaysia ........................................................................................................... 9,404 8,856 7,747
Middle East (excluding Saudi Arabia) ............................................................ 27,295 21,607 15,622
Egypt ........................................................................................................... 2,473 1,853 965
United Arab Emirates .................................................................................. 17,537 14,103 10,148
Other Middle East ....................................................................................... 7,285 5,651 4,509
Singapore ......................................................................................................... 13,441 11,505 9,610
South Korea ..................................................................................................... 5,336 7,124 6,260
Taiwan ............................................................................................................. 4,329 3,658 3,974
Other ................................................................................................................ 13,403 12,996 9,878
107,956 101,852 77,574