HSBC 2008 Annual Report Download - page 269
Download and view the complete annual report
Please find page 269 of the 2008 HSBC annual report below. You can navigate through the pages in the report by either clicking on the pages listed below, or by using the keyword search tool below to find specific information within the annual report.-
 1
1 -
2
-
3
-
4
-
5
-
6
-
7
-
8
-
9
-
10
-
11
-
12
-
13
-
14
-
15
-
16
-
17
-
18
-
19
-
20
-
21
-
22
-
23
-
24
-
25
-
26
-
27
-
28
-
29
-
30
-
31
-
32
-
33
-
34
-
35
-
36
-
37
-
38
-
39
-
40
-
41
-
42
-
43
-
44
-
45
-
46
-
47
-
48
-
49
-
50
-
51
-
52
-
53
-
54
-
55
-
56
-
57
-
58
-
59
-
60
-
61
-
62
-
63
-
64
-
65
-
66
-
67
-
68
-
69
-
70
-
71
-
72
-
73
-
74
-
75
-
76
-
77
-
78
-
79
-
80
-
81
-
82
-
83
-
84
-
85
-
86
-
87
-
88
-
89
-
90
-
91
-
92
-
93
-
94
-
95
-
96
-
97
-
98
-
99
-
100
-
101
-
102
-
103
-
104
-
105
-
106
-
107
-
108
-
109
-
110
-
111
-
112
-
113
-
114
-
115
-
116
-
117
-
118
-
119
-
120
-
121
-
122
-
123
-
124
-
125
-
126
-
127
-
128
-
129
-
130
-
131
-
132
-
133
-
134
-
135
-
136
-
137
-
138
-
139
-
140
-
141
-
142
-
143
-
144
-
145
-
146
-
147
-
148
-
149
-
150
-
151
-
152
-
153
-
154
-
155
-
156
-
157
-
158
-
159
-
160
-
161
-
162
-
163
-
164
-
165
-
166
-
167
-
168
-
169
-
170
-
171
-
172
-
173
-
174
-
175
-
176
-
177
-
178
-
179
-
180
-
181
-
182
-
183
-
184
-
185
-
186
-
187
-
188
-
189
-
190
-
191
-
192
-
193
-
194
-
195
-
196
-
197
-
198
-
199
-
200
-
201
-
202
-
203
-
204
-
205
-
206
-
207
-
208
-
209
-
210
-
211
-
212
-
213
-
214
-
215
-
216
-
217
-
218
-
219
-
220
-
221
-
222
-
223
-
224
-
225
-
226
-
227
-
228
-
229
-
230
-
231
-
232
-
233
-
234
-
235
-
236
-
237
-
238
-
239
-
240
-
241
-
242
-
243
-
244
-
245
-
246
-
247
-
248
-
249
-
250
-
251
-
252
-
253
-
254
-
255
-
256
-
257
-
258
-
 259
259 -
 260
260 -
 261
261 -
 262
262 -
 263
263 -
 264
264 -
 265
265 -
 266
266 -
 267
267 -
 268
268 -
 269
269 -
 270
270 -
 271
271 -
 272
272 -
 273
273 -
 274
274 -
 275
275 -
 276
276 -
 277
277 -
 278
278 -
 279
279 -
280
-
281
-
282
-
283
-
284
-
285
-
286
-
287
-
288
-
289
-
290
-
291
-
292
-
293
-
294
-
295
-
296
-
297
-
298
-
299
-
300
-
301
-
302
-
303
-
304
-
305
-
306
-
307
-
308
-
309
-
310
-
311
-
312
-
313
-
314
-
315
-
316
-
317
-
318
-
319
-
320
-
321
-
322
-
323
-
324
-
325
-
326
-
327
-
328
-
329
-
330
-
331
-
332
-
333
-
334
-
335
-
336
-
337
-
338
-
339
-
340
-
341
-
342
-
343
-
344
-
345
-
346
-
347
-
348
-
349
-
350
-
351
-
352
-
353
-
354
-
355
-
356
-
357
-
358
-
359
-
360
-
361
-
362
-
363
-
364
-
365
-
366
-
367
-
368
-
369
-
370
-
371
-
372
-
373
-
374
-
375
-
376
-
377
-
378
-
379
-
380
-
381
-
382
-
383
-
384
-
385
-
386
-
387
-
388
-
389
-
390
-
391
-
392
-
393
-
394
-
395
-
396
-
397
-
398
-
399
-
400
-
401
-
402
-
403
-
404
-
405
-
406
-
407
-
408
-
409
-
410
-
411
-
412
-
413
-
414
-
415
-
416
-
417
-
418
-
419
-
420
-
421
-
422
-
423
-
424
-
425
-
426
-
427
-
428
-
429
-
430
-
431
-
432
-
433
-
434
-
435
-
436
-
437
-
438
-
439
-
440
-
441
-
442
-
443
-
444
-
445
-
446
-
447
-
448
-
449
-
450
-
451
-
452
-
453
-
454
-
455
-
456
-
457
-
458
-
459
-
460
-
461
-
462
-
463
-
464
-
465
-
466
-
467
-
468
-
469
-
470
-
471
-
472
 |
 |
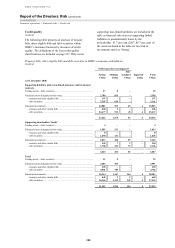
267
The sensitivity of the net profit after tax of
HSBC’s insurance subsidiaries to the effects of
increases in credit spreads is a fall of US$73 million
(2007: US$15 million fall). The sensitivity is
consistent with the other sensitivities noted above,
and is calculated using simplified assumptions based
on a one-day movement in credit spreads over a two-
year period. A confidence level of 99 per cent,
consistent with the Group’s VAR, has been applied.
The effect of movements in credit spreads became
more significant in 2008 due to increased volatility
in credit spreads.
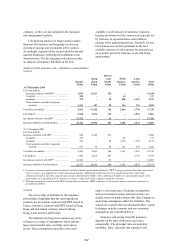
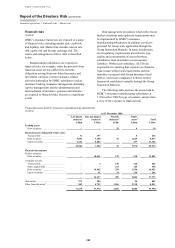
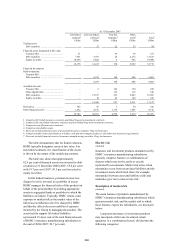
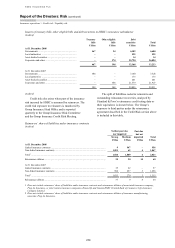
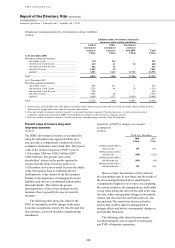
Credit risk
(Audited)
Credit risk can give rise to losses through default
and can lead to volatility in income statement and
balance sheet figures through movements in credit
spreads, principally on the US$33.2 billion (2007:
US$29.8 billion) non-linked bond portfolio. The
exposure of the income statement to the effect of
changes in credit spreads is small (see the table on
page 266). 49 per cent of the financial assets held by
insurance subsidiaries are classified as either held to
maturity or available for sale, and consequently any
changes in the fair value of these financial
investments, absent impairment, would have no
impact on the profit after tax.
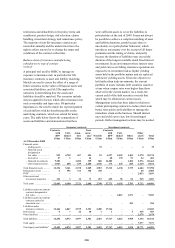
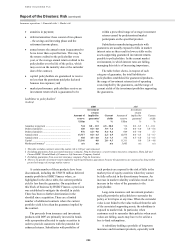
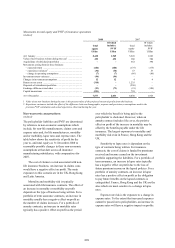
HSBC sells certain unit-linked life insurance
contracts which are reinsured with a third-party.
These insurance contracts include market return
guarantees which are underwritten by the third-party.
HSBC is exposed to credit risk to the extent that the
third-party (the counterparty) is unable to meet the
terms of the guarantees. As highlighted in ‘Market
Risk’ above, the cost to the Group of market return
guarantees increases when interest rates fall, equity
markets fall or market volatility increases. In
addition, when determined by reference to a
discounted cash flow model in which the discount
rate is based on current interest rates, guarantee costs
increase in a falling interest rate environment. As a
consequence of the rise in these costs, the Group’s
counterparty exposure to the guarantees under the
reinsurance agreement at 31 December 2008 was
greater than at 31 December 2007. During 2008,
sales of these contracts ceased, reflecting the
adjusted risk appetite of the business.
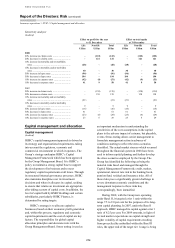
The exposure to credit risk products and the
management of the risks associated with credit
protection products are included in the description of
life and non-life insurance risk on pages 257 to 258.
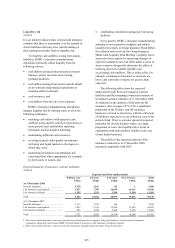
HSBC’s insurance manufacturing subsidiaries are
responsible for the credit risk, quality and
performance of their investment portfolios.
Investment credit mandates and limits are set by the
subsidiaries and approved by their local insurance
ALCOs and Credit Risk functions before being
submitted to Group Credit Risk for concurrence. The
form and content of the mandates must accord with
centrally set investment credit risk guidance
regarding credit quality, industry sector
concentration and liquidity restrictions, but allow for
the inclusion of local regulatory and country-specific
conditions. The assessment of the creditworthiness
of issuers and counterparties is based primarily upon
internationally recognised credit ratings and other
publicly available information.
Investment credit exposures are monitored
against limits by the local insurance manufacturing
subsidiaries, and are aggregated and reported to
Group Credit Risk, the Group Insurance Credit Risk
Meeting and the Group Insurance Risk Committee.
Stress testing is performed by Group Insurance Head
Office on the investment credit exposures using
credit spread sensitivities and default probabilities.
The stresses are reported to the Group Insurance
Risk Committee.
As noted above, under certain circumstances,
the Group is able to dilute the effect of investment
losses by sharing them with policyholders. However,
when, for example, a contract includes a guarantee,
losses which would result in a breach of the
guaranteed benefits due to the policyholder are borne
by the Group.
In response to adverse credit market conditions,
various initiatives were introduced during 2008 to
better manage and report credit risk, including an
Early Warning Report which is produced on a
weekly basis to identify investments which may be
at risk of future impairment. This report is circulated
to senior management in Group Insurance Head
Office and the Regional Chief Risk Officers, and
risk reduction strategies are implemented when
considered appropriate. Similarly, a watch list of
investments with current credit concerns is circulated
weekly.