HSBC 2008 Annual Report Download - page 28
Download and view the complete annual report
Please find page 28 of the 2008 HSBC annual report below. You can navigate through the pages in the report by either clicking on the pages listed below, or by using the keyword search tool below to find specific information within the annual report.-
 1
1 -
2
-
3
-
4
-
5
-
6
-
7
-
8
-
9
-
10
-
11
-
12
-
13
-
14
-
15
-
16
-
17
-
 18
18 -
 19
19 -
 20
20 -
 21
21 -
 22
22 -
 23
23 -
 24
24 -
 25
25 -
 26
26 -
 27
27 -
 28
28 -
 29
29 -
 30
30 -
 31
31 -
 32
32 -
 33
33 -
 34
34 -
 35
35 -
 36
36 -
 37
37 -
 38
38 -
39
-
40
-
41
-
42
-
43
-
44
-
45
-
46
-
47
-
48
-
49
-
50
-
51
-
52
-
53
-
54
-
55
-
56
-
57
-
58
-
59
-
60
-
61
-
62
-
63
-
64
-
65
-
66
-
67
-
68
-
69
-
70
-
71
-
72
-
73
-
74
-
75
-
76
-
77
-
78
-
79
-
80
-
81
-
82
-
83
-
84
-
85
-
86
-
87
-
88
-
89
-
90
-
91
-
92
-
93
-
94
-
95
-
96
-
97
-
98
-
99
-
100
-
101
-
102
-
103
-
104
-
105
-
106
-
107
-
108
-
109
-
110
-
111
-
112
-
113
-
114
-
115
-
116
-
117
-
118
-
119
-
120
-
121
-
122
-
123
-
124
-
125
-
126
-
127
-
128
-
129
-
130
-
131
-
132
-
133
-
134
-
135
-
136
-
137
-
138
-
139
-
140
-
141
-
142
-
143
-
144
-
145
-
146
-
147
-
148
-
149
-
150
-
151
-
152
-
153
-
154
-
155
-
156
-
157
-
158
-
159
-
160
-
161
-
162
-
163
-
164
-
165
-
166
-
167
-
168
-
169
-
170
-
171
-
172
-
173
-
174
-
175
-
176
-
177
-
178
-
179
-
180
-
181
-
182
-
183
-
184
-
185
-
186
-
187
-
188
-
189
-
190
-
191
-
192
-
193
-
194
-
195
-
196
-
197
-
198
-
199
-
200
-
201
-
202
-
203
-
204
-
205
-
206
-
207
-
208
-
209
-
210
-
211
-
212
-
213
-
214
-
215
-
216
-
217
-
218
-
219
-
220
-
221
-
222
-
223
-
224
-
225
-
226
-
227
-
228
-
229
-
230
-
231
-
232
-
233
-
234
-
235
-
236
-
237
-
238
-
239
-
240
-
241
-
242
-
243
-
244
-
245
-
246
-
247
-
248
-
249
-
250
-
251
-
252
-
253
-
254
-
255
-
256
-
257
-
258
-
259
-
260
-
261
-
262
-
263
-
264
-
265
-
266
-
267
-
268
-
269
-
270
-
271
-
272
-
273
-
274
-
275
-
276
-
277
-
278
-
279
-
280
-
281
-
282
-
283
-
284
-
285
-
286
-
287
-
288
-
289
-
290
-
291
-
292
-
293
-
294
-
295
-
296
-
297
-
298
-
299
-
300
-
301
-
302
-
303
-
304
-
305
-
306
-
307
-
308
-
309
-
310
-
311
-
312
-
313
-
314
-
315
-
316
-
317
-
318
-
319
-
320
-
321
-
322
-
323
-
324
-
325
-
326
-
327
-
328
-
329
-
330
-
331
-
332
-
333
-
334
-
335
-
336
-
337
-
338
-
339
-
340
-
341
-
342
-
343
-
344
-
345
-
346
-
347
-
348
-
349
-
350
-
351
-
352
-
353
-
354
-
355
-
356
-
357
-
358
-
359
-
360
-
361
-
362
-
363
-
364
-
365
-
366
-
367
-
368
-
369
-
370
-
371
-
372
-
373
-
374
-
375
-
376
-
377
-
378
-
379
-
380
-
381
-
382
-
383
-
384
-
385
-
386
-
387
-
388
-
389
-
390
-
391
-
392
-
393
-
394
-
395
-
396
-
397
-
398
-
399
-
400
-
401
-
402
-
403
-
404
-
405
-
406
-
407
-
408
-
409
-
410
-
411
-
412
-
413
-
414
-
415
-
416
-
417
-
418
-
419
-
420
-
421
-
422
-
423
-
424
-
425
-
426
-
427
-
428
-
429
-
430
-
431
-
432
-
433
-
434
-
435
-
436
-
437
-
438
-
439
-
440
-
441
-
442
-
443
-
444
-
445
-
446
-
447
-
448
-
449
-
450
-
451
-
452
-
453
-
454
-
455
-
456
-
457
-
458
-
459
-
460
-
461
-
462
-
463
-
464
-
465
-
466
-
467
-
468
-
469
-
470
-
471
-
472
 |
 |

HSBC HOLDINGS PLC
Report of the Directors: Operating and Financial Review (continued)
Financial summary > Group performance > Net interest income / net fee income
26
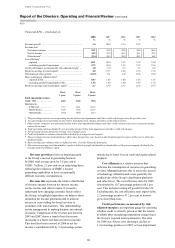
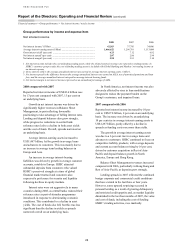
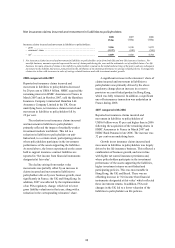
Group performance by income and expense item
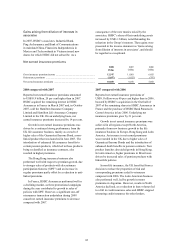
Net interest income
2008 2007 2006
Net interest income1 (US$m) ........................................................................... 42,563 37,795 34,486
Average interest-earning assets (US$m) ......................................................... 1,466,622 1,296,701 1,113,404
Gross interest yield2 (per cent) ........................................................................ 6.23 7.12 6.82
Net interest spread3 (per cent) ......................................................................... 2.87 2.86 2.94
Net interest margin4 (per cent) ........................................................................ 2.90 2.91 3.10
1 Net interest income includes the cost of funding trading assets, while the related external revenues are reported in trading income. In
HSBC’s customer group results, the cost of funding trading assets is included with Global Banking and Markets’ net trading income as
an interest expense.
2 Gross interest yield is the average annualised interest rate earned on average interest-earning assets (‘AIEA’).
3 Net interest spread is the difference between the average annualised interest rate earned on AIEA, net of amortised premiums and loan
fees, and the average annualised interest rate paid on average interest-bearing funds.
4 Net interest margin is net interest income expressed as an annualised percentage of AIEA.
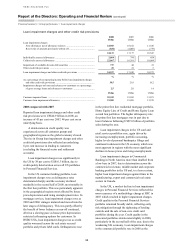
2008 compared with 2007
Reported net interest income of US$42.6 billion rose
by 13 per cent compared with 2007, 13 per cent on
an underlying basis.
Growth in net interest income was driven by
significantly higher revenues in Balance Sheet
Management, in part reflecting favourable
positioning to take advantage of falling interest rates.
Lending and deposit balances also grew strongly,
while progressive reductions in central bank
reference rates led to a decline in both asset yields
and the cost of funds. Overall, spreads narrowed on
an underlying basis.
Average interest-earning assets increased to
US$1,467 billion, led by growth in average loans
and advances to customers. This was mainly due to
an increase in average term lending balances in
Europe and Asia.
An increase in average interest-bearing
liabilities was driven by growth in average customer
accounts, notably in Europe. HSBC attracted
substantial deposits from customers who valued
HSBC’s perceived strength at a time of global
financial market turmoil and customers also
expressed a preference for security and liquidity
following declines in equity markets.
Interest rates were cut aggressively in many
countries during 2008, as central banks reduced their
reference rates as part of stimulus programmes
introduced in response to deteriorating economic
conditions. This contributed to a decline in asset
yields. The cost of funds also fell, but this was less
significant than the decline in yields as spreads
narrowed overall on an underlying basis.
In North America, net interest income was also
adversely affected by rises in loan modifications
designed to reduce the payment burden on the
Group’s customers, and impaired loans.
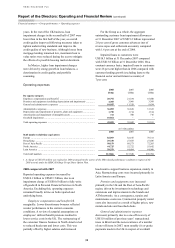
2007 compared with 2006
Reported net interest income increased by 10 per
cent to US$37.8 billion, 4 per cent on an underlying
basis. The increase was driven by an underlying
10 per cent rise in average interest earning assets to
US$1,297 billion, partly offset by a decline in
spreads as funding costs rose more than yields.
The growth in average interest earning assets
was due to a 6 per cent rise in average loans and
advances to customers. HSBC continued to focus on
competitive liability products, with average deposits
and current account balances rising by 16 per cent,
driven by customer acquisition in Rest of Asia-
Pacific and deposit balance growth in North
America, Europe and Hong Kong.
Balance Sheet Management revenues increased
compared with 2006, particularly in Hong Kong and
Rest of Asia-Pacific as deposits grew strongly.
Lending spreads in 2007 reflected the continued
benign corporate and commercial credit conditions
that have existed in the last three or four years.
However, some upward re-pricing occurred in
personal lending as a result of growing delinquency
and restricted credit appetite and, as market liquidity
diminished in the last four months of 2007, the value
and cost of funds, including the cost of funding
HSBC’s trading activities, rose markedly.