HSBC 2008 Annual Report Download - page 70
Download and view the complete annual report
Please find page 70 of the 2008 HSBC annual report below. You can navigate through the pages in the report by either clicking on the pages listed below, or by using the keyword search tool below to find specific information within the annual report.-
 1
1 -
2
-
3
-
4
-
5
-
6
-
7
-
8
-
9
-
10
-
11
-
12
-
13
-
14
-
15
-
16
-
17
-
18
-
19
-
20
-
21
-
22
-
23
-
24
-
25
-
26
-
27
-
28
-
29
-
30
-
31
-
32
-
33
-
34
-
35
-
36
-
37
-
38
-
39
-
40
-
41
-
42
-
43
-
44
-
45
-
46
-
47
-
48
-
49
-
50
-
51
-
52
-
53
-
54
-
55
-
56
-
57
-
58
-
59
-
 60
60 -
 61
61 -
 62
62 -
 63
63 -
 64
64 -
 65
65 -
 66
66 -
 67
67 -
 68
68 -
 69
69 -
 70
70 -
 71
71 -
 72
72 -
 73
73 -
 74
74 -
 75
75 -
 76
76 -
 77
77 -
 78
78 -
 79
79 -
 80
80 -
81
-
82
-
83
-
84
-
85
-
86
-
87
-
88
-
89
-
90
-
91
-
92
-
93
-
94
-
95
-
96
-
97
-
98
-
99
-
100
-
101
-
102
-
103
-
104
-
105
-
106
-
107
-
108
-
109
-
110
-
111
-
112
-
113
-
114
-
115
-
116
-
117
-
118
-
119
-
120
-
121
-
122
-
123
-
124
-
125
-
126
-
127
-
128
-
129
-
130
-
131
-
132
-
133
-
134
-
135
-
136
-
137
-
138
-
139
-
140
-
141
-
142
-
143
-
144
-
145
-
146
-
147
-
148
-
149
-
150
-
151
-
152
-
153
-
154
-
155
-
156
-
157
-
158
-
159
-
160
-
161
-
162
-
163
-
164
-
165
-
166
-
167
-
168
-
169
-
170
-
171
-
172
-
173
-
174
-
175
-
176
-
177
-
178
-
179
-
180
-
181
-
182
-
183
-
184
-
185
-
186
-
187
-
188
-
189
-
190
-
191
-
192
-
193
-
194
-
195
-
196
-
197
-
198
-
199
-
200
-
201
-
202
-
203
-
204
-
205
-
206
-
207
-
208
-
209
-
210
-
211
-
212
-
213
-
214
-
215
-
216
-
217
-
218
-
219
-
220
-
221
-
222
-
223
-
224
-
225
-
226
-
227
-
228
-
229
-
230
-
231
-
232
-
233
-
234
-
235
-
236
-
237
-
238
-
239
-
240
-
241
-
242
-
243
-
244
-
245
-
246
-
247
-
248
-
249
-
250
-
251
-
252
-
253
-
254
-
255
-
256
-
257
-
258
-
259
-
260
-
261
-
262
-
263
-
264
-
265
-
266
-
267
-
268
-
269
-
270
-
271
-
272
-
273
-
274
-
275
-
276
-
277
-
278
-
279
-
280
-
281
-
282
-
283
-
284
-
285
-
286
-
287
-
288
-
289
-
290
-
291
-
292
-
293
-
294
-
295
-
296
-
297
-
298
-
299
-
300
-
301
-
302
-
303
-
304
-
305
-
306
-
307
-
308
-
309
-
310
-
311
-
312
-
313
-
314
-
315
-
316
-
317
-
318
-
319
-
320
-
321
-
322
-
323
-
324
-
325
-
326
-
327
-
328
-
329
-
330
-
331
-
332
-
333
-
334
-
335
-
336
-
337
-
338
-
339
-
340
-
341
-
342
-
343
-
344
-
345
-
346
-
347
-
348
-
349
-
350
-
351
-
352
-
353
-
354
-
355
-
356
-
357
-
358
-
359
-
360
-
361
-
362
-
363
-
364
-
365
-
366
-
367
-
368
-
369
-
370
-
371
-
372
-
373
-
374
-
375
-
376
-
377
-
378
-
379
-
380
-
381
-
382
-
383
-
384
-
385
-
386
-
387
-
388
-
389
-
390
-
391
-
392
-
393
-
394
-
395
-
396
-
397
-
398
-
399
-
400
-
401
-
402
-
403
-
404
-
405
-
406
-
407
-
408
-
409
-
410
-
411
-
412
-
413
-
414
-
415
-
416
-
417
-
418
-
419
-
420
-
421
-
422
-
423
-
424
-
425
-
426
-
427
-
428
-
429
-
430
-
431
-
432
-
433
-
434
-
435
-
436
-
437
-
438
-
439
-
440
-
441
-
442
-
443
-
444
-
445
-
446
-
447
-
448
-
449
-
450
-
451
-
452
-
453
-
454
-
455
-
456
-
457
-
458
-
459
-
460
-
461
-
462
-
463
-
464
-
465
-
466
-
467
-
468
-
469
-
470
-
471
-
472
 |
 |

HSBC HOLDINGS PLC
Report of the Directors: Operating and Financial Review (continued)
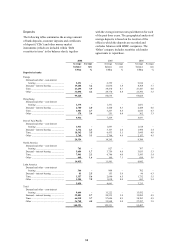
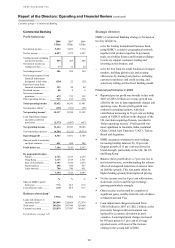
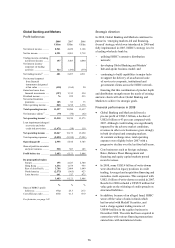
Customer groups > Personal Financial Services
68
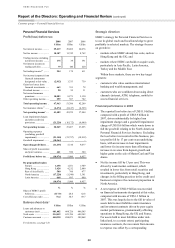
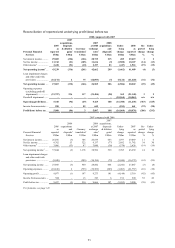
Personal Financial Services
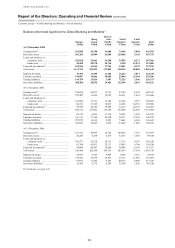
Profit/(loss) before tax
2008 2007 2006
US$m US$m US$m
Net interest income ........... 29,419 29,069 26,076
Net fee income .................. 10,107 11,742 8,762
Trading income excluding
net interest income ......... 175 38 391
Net interest income on
trading activities ............. 79 140 220
Net trading income16 ......... 254 178 611
Net income/(expense) from
financial instruments
designated at fair value .. (2,912) 1,333 739
Gains less losses from
financial investments ..... 663 351 78
Dividend income ............... 90 55 31
Net earned insurance
premiums ....................... 10,083 8,271 5,130
Other operating income .... 259 387 782
Total operating income .. 47,963 51,386 42,209
Net insurance claims17 ...... (6,474) (8,147) (4,365)
Net operating income5 ..... 41,489 43,239 37,844
Loan impairment charges
and other credit risk
provisions ....................... (21,220) (16,172) (9,949)
Net operating income ..... 20,269 27,067 27,895
Operating expenses
(excluding goodwill
impairment) .................... (21,140) (21,757) (18,818)
Goodwill impairment ........ (10,564) – –
Operating profit/(loss) .... (11,435) 5,310 9,077
Share of profit in associates
and joint ventures ........... 461 590 380
Profit/(loss) before tax .... (10,974) 5,900 9,457
By geographical region
Europe ............................ 1,658 1,581 1,909
Hong Kong ..................... 3,428 4,212 2,880
Rest of Asia-Pacific ....... 500 760 477
North America ............... (17,228) (1,546) 3,391
Latin America ................ 668 893 800
(10,974) 5,900 9,457
% % %
Share of HSBC’s profit
before tax ....................... (117.9)
24.4 42.8
Cost efficiency ratio .......... 76.4 50.3 49.7
Balance sheet data15
US$m US$m US$m
Loans and advances to
customers (net) ............... 401,402 464,726 448,545
Total assets ........................ 514,419 621,356 602,342
Customer accounts ............ 440,338 450,071 388,468
For footnotes, see page 143.
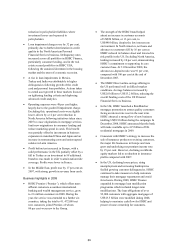
Strategic direction
HSBC’s strategy for Personal Financial Services is
to use its global reach and local knowledge to grow
profitably in selected markets. The strategy focuses
on growth in:
– markets where HSBC already has scale, such as
Hong Kong and the UK; and
– markets where HSBC can build or acquire scale,
particularly in Asia-Pacific, Latin America,
Turkey and the Middle East.
Within these markets, there are two key target
segments:
– customers who value seamless international
banking and wealth management; and
– customers who are confident about using direct
channels (internet, ATM, telephone, mobile) to
access financial services.
Financial performance in 2008
• The reported loss before tax of US$11.0 billion
compared with a profit of US$5.9 billion in
2007, driven substantially by higher loan
impairment charges and a goodwill impairment
charge of US$10.6 billion which wrote down in
full the goodwill relating to the North American
Personal Financial Services business. Excluding
the loss before tax incurred in this business, pre-
tax profits fell by 17 per cent on an underlying
basis, with an increase in loan impairments
and lower fee income more than offsetting an
increase in revenue from deposit growth and
higher gains on the sale of MasterCard and Visa
shares.
• Net fee income fell by 13 per cent. This was
driven by weak market sentiment, which
resulted in lower fees from retail securities and
investments, particularly in Hong Kong, and
changes in fee billing practices in the credit card
business to improve the customer proposition in
North America.
• A net expense of US$2.9 billion was recorded
on financial instruments designated at fair value,
compared with income of US$1.3 billion in
2007. This was largely due to the fall in value of
assets held to meet liabilities under insurance
and investment contracts driven by poor equity
market performances, predominantly affecting
operations in Hong Kong, the UK and France.
For assets held to meet liabilities under unit-
linked and, to a certain extent, participating
insurance contracts, the movement from income
to expense was offset by a corresponding