HSBC 2008 Annual Report Download - page 111
Download and view the complete annual report
Please find page 111 of the 2008 HSBC annual report below. You can navigate through the pages in the report by either clicking on the pages listed below, or by using the keyword search tool below to find specific information within the annual report.-
 1
1 -
2
-
3
-
4
-
5
-
6
-
7
-
8
-
9
-
10
-
11
-
12
-
13
-
14
-
15
-
16
-
17
-
18
-
19
-
20
-
21
-
22
-
23
-
24
-
25
-
26
-
27
-
28
-
29
-
30
-
31
-
32
-
33
-
34
-
35
-
36
-
37
-
38
-
39
-
40
-
41
-
42
-
43
-
44
-
45
-
46
-
47
-
48
-
49
-
50
-
51
-
52
-
53
-
54
-
55
-
56
-
57
-
58
-
59
-
60
-
61
-
62
-
63
-
64
-
65
-
66
-
67
-
68
-
69
-
70
-
71
-
72
-
73
-
74
-
75
-
76
-
77
-
78
-
79
-
80
-
81
-
82
-
83
-
84
-
85
-
86
-
87
-
88
-
89
-
90
-
91
-
92
-
93
-
94
-
95
-
96
-
97
-
98
-
99
-
100
-
 101
101 -
 102
102 -
 103
103 -
 104
104 -
 105
105 -
 106
106 -
 107
107 -
 108
108 -
 109
109 -
 110
110 -
 111
111 -
 112
112 -
 113
113 -
 114
114 -
 115
115 -
 116
116 -
 117
117 -
 118
118 -
 119
119 -
 120
120 -
 121
121 -
122
-
123
-
124
-
125
-
126
-
127
-
128
-
129
-
130
-
131
-
132
-
133
-
134
-
135
-
136
-
137
-
138
-
139
-
140
-
141
-
142
-
143
-
144
-
145
-
146
-
147
-
148
-
149
-
150
-
151
-
152
-
153
-
154
-
155
-
156
-
157
-
158
-
159
-
160
-
161
-
162
-
163
-
164
-
165
-
166
-
167
-
168
-
169
-
170
-
171
-
172
-
173
-
174
-
175
-
176
-
177
-
178
-
179
-
180
-
181
-
182
-
183
-
184
-
185
-
186
-
187
-
188
-
189
-
190
-
191
-
192
-
193
-
194
-
195
-
196
-
197
-
198
-
199
-
200
-
201
-
202
-
203
-
204
-
205
-
206
-
207
-
208
-
209
-
210
-
211
-
212
-
213
-
214
-
215
-
216
-
217
-
218
-
219
-
220
-
221
-
222
-
223
-
224
-
225
-
226
-
227
-
228
-
229
-
230
-
231
-
232
-
233
-
234
-
235
-
236
-
237
-
238
-
239
-
240
-
241
-
242
-
243
-
244
-
245
-
246
-
247
-
248
-
249
-
250
-
251
-
252
-
253
-
254
-
255
-
256
-
257
-
258
-
259
-
260
-
261
-
262
-
263
-
264
-
265
-
266
-
267
-
268
-
269
-
270
-
271
-
272
-
273
-
274
-
275
-
276
-
277
-
278
-
279
-
280
-
281
-
282
-
283
-
284
-
285
-
286
-
287
-
288
-
289
-
290
-
291
-
292
-
293
-
294
-
295
-
296
-
297
-
298
-
299
-
300
-
301
-
302
-
303
-
304
-
305
-
306
-
307
-
308
-
309
-
310
-
311
-
312
-
313
-
314
-
315
-
316
-
317
-
318
-
319
-
320
-
321
-
322
-
323
-
324
-
325
-
326
-
327
-
328
-
329
-
330
-
331
-
332
-
333
-
334
-
335
-
336
-
337
-
338
-
339
-
340
-
341
-
342
-
343
-
344
-
345
-
346
-
347
-
348
-
349
-
350
-
351
-
352
-
353
-
354
-
355
-
356
-
357
-
358
-
359
-
360
-
361
-
362
-
363
-
364
-
365
-
366
-
367
-
368
-
369
-
370
-
371
-
372
-
373
-
374
-
375
-
376
-
377
-
378
-
379
-
380
-
381
-
382
-
383
-
384
-
385
-
386
-
387
-
388
-
389
-
390
-
391
-
392
-
393
-
394
-
395
-
396
-
397
-
398
-
399
-
400
-
401
-
402
-
403
-
404
-
405
-
406
-
407
-
408
-
409
-
410
-
411
-
412
-
413
-
414
-
415
-
416
-
417
-
418
-
419
-
420
-
421
-
422
-
423
-
424
-
425
-
426
-
427
-
428
-
429
-
430
-
431
-
432
-
433
-
434
-
435
-
436
-
437
-
438
-
439
-
440
-
441
-
442
-
443
-
444
-
445
-
446
-
447
-
448
-
449
-
450
-
451
-
452
-
453
-
454
-
455
-
456
-
457
-
458
-
459
-
460
-
461
-
462
-
463
-
464
-
465
-
466
-
467
-
468
-
469
-
470
-
471
-
472
 |
 |

109
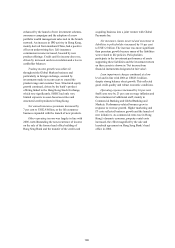
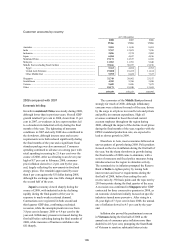
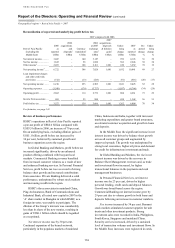
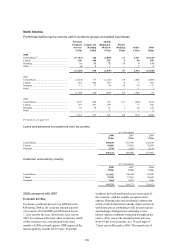
Customer accounts by country
At 31 December
2008
US$m
2007
US$m
2006
US$m
Australia ........................................................................................................... 9,201 11,418 8,491
India ................................................................................................................. 9,767 12,021 7,936
Indonesia .......................................................................................................... 2,896 2,574 2,082
Japan ................................................................................................................ 6,204 4,657 4,186
Mainland China ............................................................................................... 19,171 14,537 6,941
Malaysia ........................................................................................................... 11,963 11,701 9,640
Middle East (excluding Saudi Arabia) ............................................................ 35,166 30,937 21,196
Egypt ........................................................................................................... 5,363 4,056 2,703
United Arab Emirates .................................................................................. 19,808 18,455 11,166
Other Middle East ....................................................................................... 9,995 8,426 7,327
Singapore ......................................................................................................... 32,748 28,962 23,517
South Korea ..................................................................................................... 4,383 5,760 3,890
Taiwan ............................................................................................................. 9,689 9,426 7,675
Other ................................................................................................................ 18,171 18,240 13,441
159,359 150,233 108,995
2008 compared with 2007
Economic briefing
Growth in mainland China was steady during 2008,
although lower than in previous years. Overall GDP
growth totalled 9 per cent in 2008, down from 13 per
cent in 2007, as weakness in key export markets led
to a slowdown in industrial activity during the final
months of the year. The tightening of monetary
conditions in 2007 and early 2008 also contributed to
the slowdown, although interest rates and reserve
requirements were both reduced significantly during
the final months of the year and a significant fiscal
stimulus package was also announced. Consumer
spending continued to advance at a strong pace with
retail spending increasing by 21.6 per cent over the
course of 2008. After accelerating to an eleven year
high of 8.7 per cent in February 2008, consumer
price inflation slowed to 1.2 per cent by the year-
end, largely reflecting the movements in food and
energy prices. The renminbi appreciated by more
than 6 per cent against the US dollar during 2008,
although the exchange rate was little changed during
the second half of the year.
Japan’s economy slowed sharply during the
course of 2008, with industrial activity declining
rapidly during the final quarter of the year in
response to much weaker external demand.
Contractions were registered in both second and
third quarter GDP data, confirming a technical
recession, while the unemployment rate rose from
3.8 per cent in January 2008 to 4.4 per cent by the
year-end. Inflationary pressures increased during the
first half before subsiding during the final months of
2008, while measures of business confidence also
fell sharply.
The economies of the Middle East performed
strongly for much of 2008, although inflationary
concerns were a feature for much of the year, driven
by the surge in oil prices to record levels and private
and public investment expenditure. High oil
revenues continued to boost fiscal and current
account surpluses throughout the region during
2008, although the impact of the decline in oil prices
during the final months of the year, together with the
OPEC-mandated production cuts, are expected to
lead to slower growth in 2009.
Elsewhere in Asia, most economies followed an
uneven pattern of growth during 2008. Policymakers
focused on the rise in inflation during the first half of
the year, but the sharp slowdown in growth during
the final months of 2008 came to dominate, with a
series of monetary and fiscal policy measures being
introduced across the region to stimulate activity.
The sustained rise in inflation prompted the Reserve
Bank of India to tighten policy by raising both
interest rates and reserve requirements during the
first half of 2008, before then cutting the cash
reserve ratio by 350 basis points and the repo rate by
250 basis points during the final quarter of the year.
A recession was confirmed in Singapore after GDP
contracted for three consecutive quarters in 2008, as
an economic slowdown initially focused on specific
industries turned more pervasive. After rising to a
26-year high of 7.5 per cent in June 2008, the annual
rate of inflation slowed to 4.3 per cent by the year-
end.
Inflation also proved the predominant concern
in Vietnam during the first half of 2008 as the
annual rate of consumer price inflation more than
doubled to 28.3 per cent, prompting the State Bank
of Vietnam to sanction substantial interest rate