HSBC 2008 Annual Report Download - page 121
Download and view the complete annual report
Please find page 121 of the 2008 HSBC annual report below. You can navigate through the pages in the report by either clicking on the pages listed below, or by using the keyword search tool below to find specific information within the annual report.-
 1
1 -
2
-
3
-
4
-
5
-
6
-
7
-
8
-
9
-
10
-
11
-
12
-
13
-
14
-
15
-
16
-
17
-
18
-
19
-
20
-
21
-
22
-
23
-
24
-
25
-
26
-
27
-
28
-
29
-
30
-
31
-
32
-
33
-
34
-
35
-
36
-
37
-
38
-
39
-
40
-
41
-
42
-
43
-
44
-
45
-
46
-
47
-
48
-
49
-
50
-
51
-
52
-
53
-
54
-
55
-
56
-
57
-
58
-
59
-
60
-
61
-
62
-
63
-
64
-
65
-
66
-
67
-
68
-
69
-
70
-
71
-
72
-
73
-
74
-
75
-
76
-
77
-
78
-
79
-
80
-
81
-
82
-
83
-
84
-
85
-
86
-
87
-
88
-
89
-
90
-
91
-
92
-
93
-
94
-
95
-
96
-
97
-
98
-
99
-
100
-
101
-
102
-
103
-
104
-
105
-
106
-
107
-
108
-
109
-
110
-
 111
111 -
 112
112 -
 113
113 -
 114
114 -
 115
115 -
 116
116 -
 117
117 -
 118
118 -
 119
119 -
 120
120 -
 121
121 -
 122
122 -
 123
123 -
 124
124 -
 125
125 -
 126
126 -
 127
127 -
 128
128 -
 129
129 -
 130
130 -
 131
131 -
132
-
133
-
134
-
135
-
136
-
137
-
138
-
139
-
140
-
141
-
142
-
143
-
144
-
145
-
146
-
147
-
148
-
149
-
150
-
151
-
152
-
153
-
154
-
155
-
156
-
157
-
158
-
159
-
160
-
161
-
162
-
163
-
164
-
165
-
166
-
167
-
168
-
169
-
170
-
171
-
172
-
173
-
174
-
175
-
176
-
177
-
178
-
179
-
180
-
181
-
182
-
183
-
184
-
185
-
186
-
187
-
188
-
189
-
190
-
191
-
192
-
193
-
194
-
195
-
196
-
197
-
198
-
199
-
200
-
201
-
202
-
203
-
204
-
205
-
206
-
207
-
208
-
209
-
210
-
211
-
212
-
213
-
214
-
215
-
216
-
217
-
218
-
219
-
220
-
221
-
222
-
223
-
224
-
225
-
226
-
227
-
228
-
229
-
230
-
231
-
232
-
233
-
234
-
235
-
236
-
237
-
238
-
239
-
240
-
241
-
242
-
243
-
244
-
245
-
246
-
247
-
248
-
249
-
250
-
251
-
252
-
253
-
254
-
255
-
256
-
257
-
258
-
259
-
260
-
261
-
262
-
263
-
264
-
265
-
266
-
267
-
268
-
269
-
270
-
271
-
272
-
273
-
274
-
275
-
276
-
277
-
278
-
279
-
280
-
281
-
282
-
283
-
284
-
285
-
286
-
287
-
288
-
289
-
290
-
291
-
292
-
293
-
294
-
295
-
296
-
297
-
298
-
299
-
300
-
301
-
302
-
303
-
304
-
305
-
306
-
307
-
308
-
309
-
310
-
311
-
312
-
313
-
314
-
315
-
316
-
317
-
318
-
319
-
320
-
321
-
322
-
323
-
324
-
325
-
326
-
327
-
328
-
329
-
330
-
331
-
332
-
333
-
334
-
335
-
336
-
337
-
338
-
339
-
340
-
341
-
342
-
343
-
344
-
345
-
346
-
347
-
348
-
349
-
350
-
351
-
352
-
353
-
354
-
355
-
356
-
357
-
358
-
359
-
360
-
361
-
362
-
363
-
364
-
365
-
366
-
367
-
368
-
369
-
370
-
371
-
372
-
373
-
374
-
375
-
376
-
377
-
378
-
379
-
380
-
381
-
382
-
383
-
384
-
385
-
386
-
387
-
388
-
389
-
390
-
391
-
392
-
393
-
394
-
395
-
396
-
397
-
398
-
399
-
400
-
401
-
402
-
403
-
404
-
405
-
406
-
407
-
408
-
409
-
410
-
411
-
412
-
413
-
414
-
415
-
416
-
417
-
418
-
419
-
420
-
421
-
422
-
423
-
424
-
425
-
426
-
427
-
428
-
429
-
430
-
431
-
432
-
433
-
434
-
435
-
436
-
437
-
438
-
439
-
440
-
441
-
442
-
443
-
444
-
445
-
446
-
447
-
448
-
449
-
450
-
451
-
452
-
453
-
454
-
455
-
456
-
457
-
458
-
459
-
460
-
461
-
462
-
463
-
464
-
465
-
466
-
467
-
468
-
469
-
470
-
471
-
472
 |
 |

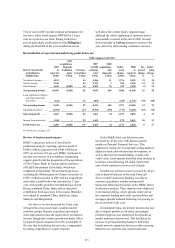
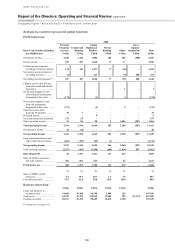
119
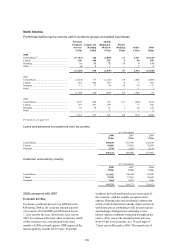
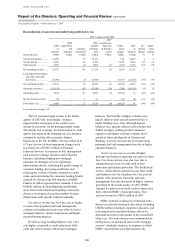
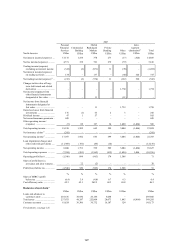
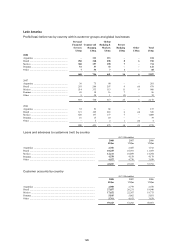
North America
Profit/(loss) before tax by country within customer groups and global businesses
Personal
Financial
Services
US$m
Commercial
Banking
US$m
Global
Banking &
Markets
US$m
Private
Banking
US$m
Other
US$m
Total
US$m
2008
United States23 .................................................. (17,364) 226 (2,899) 67 3,427 (16,543)
Canada .............................................................. 106 380 252 5 96 839
Bermuda ............................................................ 31 51 72 11 9 174
Other ................................................................. (1) 1 – – 2 2
(17,228) 658 (2,575) 83 3,534 (15,528)
2007
United States ..................................................... (1,824) 377 (1,243) 156 1,468 (1,066)
Canada .............................................................. 265 466 239 8 5 983
Bermuda ............................................................ 13 77 39 10 34 173
Other ................................................................. – – – – 1 1
(1,546) 920 (965) 174 1,508 91
2006
United States ..................................................... 3,128 442 199 107 (264) 3,612
Canada .............................................................. 253 437 189 – 17 896
Bermuda ............................................................ 10 78 31 7 29 155
Other ................................................................. – – 4 – 1 5
3,391 957 423 114 (217) 4,668
For footnote, see page 143.
Loans and advances to customers (net) by country
At 31 December
2008
US$m
2007
US$m
2006
US$m
United States .................................................................................................... 208,834 233,706 236,188
Canada ............................................................................................................. 44,866 53,891 39,584
Bermuda ........................................................................................................... 2,514 2,263 2,215
256,214 289,860 277,987
Customer accounts by country
At 31 December
2008
US$m
2007
US$m
2006
US$m
United States .................................................................................................... 101,963 100,034 84,560
Canada ............................................................................................................. 33,905 37,061 28,668
Bermuda ........................................................................................................... 7,664 8,078 7,694
143,532 145,173 120,922
2008 compared with 2007
Economic briefing
Economic conditions proved very difficult in the
US during 2008 as the economy entered a period
of recession. Overall GDP growth slowed to just
1.1 per cent for the year, down from 2 per cent in
2007. In common with many other economies, much
of this weakness was concentrated in the final
months of 2008 as fourth quarter GDP registered the
largest quarterly decline for 26 years. Economic
weakness proved broad-based across most areas of
the economy, with the notable exception of net
exports. Housing sales and residential construction
activity both declined from already depressed levels,
with house prices continuing to fall in most regions
and mortgage delinquencies continuing to rise.
Labour market conditions weakened throughout the
course of the year as the unemployment rate rose
from 4.9 per cent in January to a 15-year high of
7.2 per cent in December 2008. The annual rate of