HSBC 2008 Annual Report Download - page 207
Download and view the complete annual report
Please find page 207 of the 2008 HSBC annual report below. You can navigate through the pages in the report by either clicking on the pages listed below, or by using the keyword search tool below to find specific information within the annual report.-
 1
1 -
2
-
3
-
4
-
5
-
6
-
7
-
8
-
9
-
10
-
11
-
12
-
13
-
14
-
15
-
16
-
17
-
18
-
19
-
20
-
21
-
22
-
23
-
24
-
25
-
26
-
27
-
28
-
29
-
30
-
31
-
32
-
33
-
34
-
35
-
36
-
37
-
38
-
39
-
40
-
41
-
42
-
43
-
44
-
45
-
46
-
47
-
48
-
49
-
50
-
51
-
52
-
53
-
54
-
55
-
56
-
57
-
58
-
59
-
60
-
61
-
62
-
63
-
64
-
65
-
66
-
67
-
68
-
69
-
70
-
71
-
72
-
73
-
74
-
75
-
76
-
77
-
78
-
79
-
80
-
81
-
82
-
83
-
84
-
85
-
86
-
87
-
88
-
89
-
90
-
91
-
92
-
93
-
94
-
95
-
96
-
97
-
98
-
99
-
100
-
101
-
102
-
103
-
104
-
105
-
106
-
107
-
108
-
109
-
110
-
111
-
112
-
113
-
114
-
115
-
116
-
117
-
118
-
119
-
120
-
121
-
122
-
123
-
124
-
125
-
126
-
127
-
128
-
129
-
130
-
131
-
132
-
133
-
134
-
135
-
136
-
137
-
138
-
139
-
140
-
141
-
142
-
143
-
144
-
145
-
146
-
147
-
148
-
149
-
150
-
151
-
152
-
153
-
154
-
155
-
156
-
157
-
158
-
159
-
160
-
161
-
162
-
163
-
164
-
165
-
166
-
167
-
168
-
169
-
170
-
171
-
172
-
173
-
174
-
175
-
176
-
177
-
178
-
179
-
180
-
181
-
182
-
183
-
184
-
185
-
186
-
187
-
188
-
189
-
190
-
191
-
192
-
193
-
194
-
195
-
196
-
 197
197 -
 198
198 -
 199
199 -
 200
200 -
 201
201 -
 202
202 -
 203
203 -
 204
204 -
 205
205 -
 206
206 -
 207
207 -
 208
208 -
 209
209 -
 210
210 -
 211
211 -
 212
212 -
 213
213 -
 214
214 -
 215
215 -
 216
216 -
 217
217 -
218
-
219
-
220
-
221
-
222
-
223
-
224
-
225
-
226
-
227
-
228
-
229
-
230
-
231
-
232
-
233
-
234
-
235
-
236
-
237
-
238
-
239
-
240
-
241
-
242
-
243
-
244
-
245
-
246
-
247
-
248
-
249
-
250
-
251
-
252
-
253
-
254
-
255
-
256
-
257
-
258
-
259
-
260
-
261
-
262
-
263
-
264
-
265
-
266
-
267
-
268
-
269
-
270
-
271
-
272
-
273
-
274
-
275
-
276
-
277
-
278
-
279
-
280
-
281
-
282
-
283
-
284
-
285
-
286
-
287
-
288
-
289
-
290
-
291
-
292
-
293
-
294
-
295
-
296
-
297
-
298
-
299
-
300
-
301
-
302
-
303
-
304
-
305
-
306
-
307
-
308
-
309
-
310
-
311
-
312
-
313
-
314
-
315
-
316
-
317
-
318
-
319
-
320
-
321
-
322
-
323
-
324
-
325
-
326
-
327
-
328
-
329
-
330
-
331
-
332
-
333
-
334
-
335
-
336
-
337
-
338
-
339
-
340
-
341
-
342
-
343
-
344
-
345
-
346
-
347
-
348
-
349
-
350
-
351
-
352
-
353
-
354
-
355
-
356
-
357
-
358
-
359
-
360
-
361
-
362
-
363
-
364
-
365
-
366
-
367
-
368
-
369
-
370
-
371
-
372
-
373
-
374
-
375
-
376
-
377
-
378
-
379
-
380
-
381
-
382
-
383
-
384
-
385
-
386
-
387
-
388
-
389
-
390
-
391
-
392
-
393
-
394
-
395
-
396
-
397
-
398
-
399
-
400
-
401
-
402
-
403
-
404
-
405
-
406
-
407
-
408
-
409
-
410
-
411
-
412
-
413
-
414
-
415
-
416
-
417
-
418
-
419
-
420
-
421
-
422
-
423
-
424
-
425
-
426
-
427
-
428
-
429
-
430
-
431
-
432
-
433
-
434
-
435
-
436
-
437
-
438
-
439
-
440
-
441
-
442
-
443
-
444
-
445
-
446
-
447
-
448
-
449
-
450
-
451
-
452
-
453
-
454
-
455
-
456
-
457
-
458
-
459
-
460
-
461
-
462
-
463
-
464
-
465
-
466
-
467
-
468
-
469
-
470
-
471
-
472
 |
 |

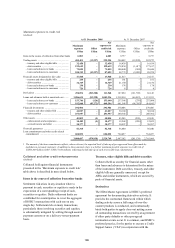
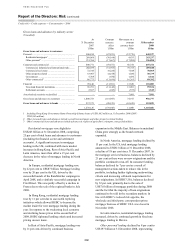
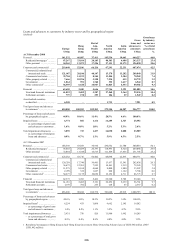
205
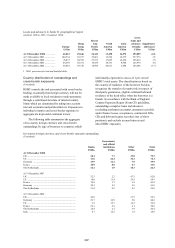
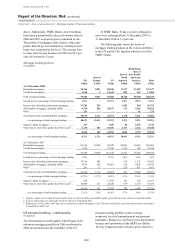
Loans and advances to customers by industry sector and by geographical region
(Audited)
Europe
Hong
Kong
Rest of
Asia-
Pacific
North
America
Latin
America
Gross
loans and
advances to
customers
Gross loans
by industry
sector as a
% of total
gross loans
US$m US$m US$m US$m US$m US$m %
At 31 December 2008
Personal ........................................ 141,532 46,087 37,411 195,534 19,663 440,227 46.0
Residential mortgages1 ............ 87,267 33,014 20,185 98,383 4,488 243,337 25.4
Other personal ......................... 54,265 13,073 17,226 97,151 15,175 196,890 20.6
Corporate and commercial .......... 219,640 52,186 66,126 47,291 22,231 407,474 42.5
Commercial, industrial and
international trade ............... 121,047 20,186 40,147 15,178 13,282 209,840 21.9
Commercial real estate ............ 32,704 14,233 8,144 13,504 2,384 70,969 7.4
Other property-related ............. 7,666 10,296 5,128 7,234 415 30,739 3.2
Government ............................. 1,864 951 1,760 352 1,617 6,544 0.7
Other commercial2 ................... 56,359 6,520 10,947 11,023 4,533 89,382 9.3
Financial ...................................... 62,620 2,680 5,646 27,746 2,393 101,085 10.6
Non-bank financial institutions 61,823 2,402 5,387 27,560 2,364 99,536 10.4
Settlement accounts ................. 797 278 259 186 29 1,549 0.2
Asset-backed securities
reclassified................................ 6,258 – – 1,733 – 7,991 0.9
Total gross loans and advances
to customers3 ............................ 430,050 100,953 109,183 272,304 44,287 956,777 100.0
Percentage of loans and advances
by geographical region ............ 44.9% 10.6% 11.4% 28.5% 4.6% 100.0%
Impaired loans ............................. 6,774 852 1,114 14,285 2,327 25,352
– as a percentage of gross loans
and advances to customers .. 1.6% 0.8% 1.0% 5.2% 5.3% 2.6%
Total impairment allowances ...... 3,859 733 1,227 16,090 2,000 23,909
– as a percentage of total gross
loans and advances .............. 0.9% 0.7% 1.1% 5.9% 4.5% 2.5%
At 31 December 2007
Personal ........................................ 168,549 43,033 36,910 230,562 21,780 500,834 50.1
Residential mortgages1 ............ 95,665 29,689 20,397 118,993 4,324 269,068 26.9
Other personal ......................... 72,884 13,344 16,513 111,569 17,456 231,766 23.2
Corporate and commercial .......... 225,282 43,716 60,442 48,898 22,433 400,771 40.0
Commercial, industrial and
international trade ............... 120,359 17,740 36,461 13,937 13,541 202,038 20.1
Commercial real estate ............ 36,672 12,301 7,592 14,561 1,219 72,345 7.2
Other property-related ............. 11,275 8,168 4,664 8,000 1,800 33,907 3.4
Government ............................. 2,299 332 1,667 248 1,162 5,708 0.6
Other commercial2 ................... 54,677 5,175 10,058 12,152 4,711 86,773 8.7
Financial ...................................... 62,375 3,265 5,426 22,380 5,702 99,148 9.9
Non-bank financial institutions 61,216 2,483 5,191 22,252 5,639 96,781 9.7
Settlement accounts ................. 1,159 782 235 128 63 2,367 0.2
Total gross loans and advances
to customers3 ............................ 456,206 90,014 102,778 301,840 49,915 1,000,753 100 .0
Percentage of loans and advances
by geographical region ............ 45.6% 9.0% 10.2% 30.2% 5.0% 100.0%
Impaired loans4 ............................ 6,254 433 1,088 9,662 2,145 19,582
– as a percentage of gross loans
and advances to customers .. 1.4% 0.5% 1.1% 3.2% 4.3% 2.0%
Total impairment allowances ...... 3,931 376 926 11,980 1,992 19,205
– as a percentage of total gross
loans and advances .............. 0.9% 0.4% 0.9% 4.0% 4.0% 1.9%
1 Residential mortgages in Hong Kong include Hong Kong Government Home Ownership Scheme loans of US$3,882 million (2007:
US$3,942 million).