HSBC 2008 Annual Report Download - page 170
Download and view the complete annual report
Please find page 170 of the 2008 HSBC annual report below. You can navigate through the pages in the report by either clicking on the pages listed below, or by using the keyword search tool below to find specific information within the annual report.-
 1
1 -
2
-
3
-
4
-
5
-
6
-
7
-
8
-
9
-
10
-
11
-
12
-
13
-
14
-
15
-
16
-
17
-
18
-
19
-
20
-
21
-
22
-
23
-
24
-
25
-
26
-
27
-
28
-
29
-
30
-
31
-
32
-
33
-
34
-
35
-
36
-
37
-
38
-
39
-
40
-
41
-
42
-
43
-
44
-
45
-
46
-
47
-
48
-
49
-
50
-
51
-
52
-
53
-
54
-
55
-
56
-
57
-
58
-
59
-
60
-
61
-
62
-
63
-
64
-
65
-
66
-
67
-
68
-
69
-
70
-
71
-
72
-
73
-
74
-
75
-
76
-
77
-
78
-
79
-
80
-
81
-
82
-
83
-
84
-
85
-
86
-
87
-
88
-
89
-
90
-
91
-
92
-
93
-
94
-
95
-
96
-
97
-
98
-
99
-
100
-
101
-
102
-
103
-
104
-
105
-
106
-
107
-
108
-
109
-
110
-
111
-
112
-
113
-
114
-
115
-
116
-
117
-
118
-
119
-
120
-
121
-
122
-
123
-
124
-
125
-
126
-
127
-
128
-
129
-
130
-
131
-
132
-
133
-
134
-
135
-
136
-
137
-
138
-
139
-
140
-
141
-
142
-
143
-
144
-
145
-
146
-
147
-
148
-
149
-
150
-
151
-
152
-
153
-
154
-
155
-
156
-
157
-
158
-
159
-
 160
160 -
 161
161 -
 162
162 -
 163
163 -
 164
164 -
 165
165 -
 166
166 -
 167
167 -
 168
168 -
 169
169 -
 170
170 -
 171
171 -
 172
172 -
 173
173 -
 174
174 -
 175
175 -
 176
176 -
 177
177 -
 178
178 -
 179
179 -
 180
180 -
181
-
182
-
183
-
184
-
185
-
186
-
187
-
188
-
189
-
190
-
191
-
192
-
193
-
194
-
195
-
196
-
197
-
198
-
199
-
200
-
201
-
202
-
203
-
204
-
205
-
206
-
207
-
208
-
209
-
210
-
211
-
212
-
213
-
214
-
215
-
216
-
217
-
218
-
219
-
220
-
221
-
222
-
223
-
224
-
225
-
226
-
227
-
228
-
229
-
230
-
231
-
232
-
233
-
234
-
235
-
236
-
237
-
238
-
239
-
240
-
241
-
242
-
243
-
244
-
245
-
246
-
247
-
248
-
249
-
250
-
251
-
252
-
253
-
254
-
255
-
256
-
257
-
258
-
259
-
260
-
261
-
262
-
263
-
264
-
265
-
266
-
267
-
268
-
269
-
270
-
271
-
272
-
273
-
274
-
275
-
276
-
277
-
278
-
279
-
280
-
281
-
282
-
283
-
284
-
285
-
286
-
287
-
288
-
289
-
290
-
291
-
292
-
293
-
294
-
295
-
296
-
297
-
298
-
299
-
300
-
301
-
302
-
303
-
304
-
305
-
306
-
307
-
308
-
309
-
310
-
311
-
312
-
313
-
314
-
315
-
316
-
317
-
318
-
319
-
320
-
321
-
322
-
323
-
324
-
325
-
326
-
327
-
328
-
329
-
330
-
331
-
332
-
333
-
334
-
335
-
336
-
337
-
338
-
339
-
340
-
341
-
342
-
343
-
344
-
345
-
346
-
347
-
348
-
349
-
350
-
351
-
352
-
353
-
354
-
355
-
356
-
357
-
358
-
359
-
360
-
361
-
362
-
363
-
364
-
365
-
366
-
367
-
368
-
369
-
370
-
371
-
372
-
373
-
374
-
375
-
376
-
377
-
378
-
379
-
380
-
381
-
382
-
383
-
384
-
385
-
386
-
387
-
388
-
389
-
390
-
391
-
392
-
393
-
394
-
395
-
396
-
397
-
398
-
399
-
400
-
401
-
402
-
403
-
404
-
405
-
406
-
407
-
408
-
409
-
410
-
411
-
412
-
413
-
414
-
415
-
416
-
417
-
418
-
419
-
420
-
421
-
422
-
423
-
424
-
425
-
426
-
427
-
428
-
429
-
430
-
431
-
432
-
433
-
434
-
435
-
436
-
437
-
438
-
439
-
440
-
441
-
442
-
443
-
444
-
445
-
446
-
447
-
448
-
449
-
450
-
451
-
452
-
453
-
454
-
455
-
456
-
457
-
458
-
459
-
460
-
461
-
462
-
463
-
464
-
465
-
466
-
467
-
468
-
469
-
470
-
471
-
472
 |
 |

HSBC HOLDINGS PLC
Report of the Directors: Impact of Market Turmoil (continued)
Fair values of financial instruments > Carried at fair value
168
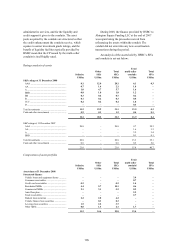
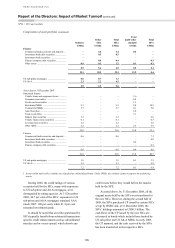
Principal assumptions used in the valuation of financial instruments with significant unobservable inputs (continued)
Reflected in profit or loss Reflected in equity
Favourable
changes
Unfavourable
changes
Favourable
changes
Unfavourable
changes
US$m US$m US$m US$m
At 31 December 2007 ...................................................
Private equity investments ............................................ – – 228 (228)
Asset-backed securities ................................................ 226 (178) 101 (163)
Leveraged finance ........................................................ 49 (49) – –
Loans held for securitisation ........................................ 40 (40) – –
Structured notes ............................................................ 17 (17) – –
Derivatives with monolines .......................................... 88 (109) – –
Other derivatives ........................................................... 132 (6) – –
Other portfolios ............................................................. 80 (46) 200 (200)
Favourable and unfavourable changes are
determined on the basis of changes in the value of
the instrument as a result of varying the levels of the
unobservable parameter using statistical techniques.
When parameters are not amenable to statistical
analysis, quantification of uncertainty is
judgemental.
When the fair value of a financial instrument is
affected by more than one unobservable assumption,
the above table reflects the most favourable or most
unfavourable change from varying the assumptions
individually.
In respect of private equity investments, the
valuations are assessed on an asset by asset basis
using a valuation methodology appropriate to the
specific investment, in line with industry guidelines.
In many of the methodologies, the principal
assumption is the valuation multiple to be applied to
the main financial indicators including, for example,
multiples for comparable listed companies and
discounts for marketability.
For ABSs whose prices are unobservable,
models are used to generate the expected value of
the asset, incorporating benchmark information on
factors such as prepayment speeds, default rates, loss
severities and the historical performance of the
underlying assets. The models used are calibrated by
using securities for which external market
information is available.
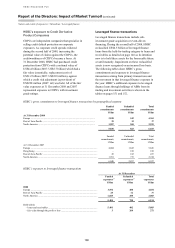
For leveraged finance, loans held for
securitisation and derivatives with monolines the
principal assumption concerns the appropriate value
to be attributed to the counterparty credit risk. This
requires exposure at default, probability of default
and recovery in the event of default to be estimated.
For loan transactions, assessment of exposure at
default is straight-forward. For derivative
transactions, a future exposure profile is generated
based on current market data. Probabilities of default
and recovery levels are estimated using market
evidence, which may include financial information,
historical experience, CDS spreads and consensus
recovery levels.
In the absence of such evidence, management’s
best estimate is used.
For structured notes and other derivatives,
principal assumptions concern the future volatility of
asset values and the future correlation between asset
values. For such unobservable assumptions,
estimates are based on available market data, which
may include the use of a proxy method to derive a
volatility or a correlation from comparable assets for
which market data is more readily available, and/or
an examination of historical levels.
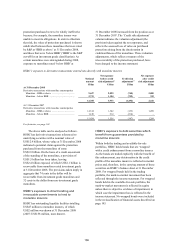
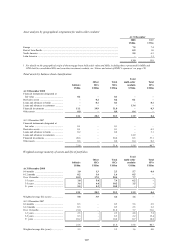
Changes in fair value recorded in the income
statement
The following table quantifies the changes in fair
values recognised in profit or loss during the year in
respect of exposures whose fair values are estimated
using valuation techniques that incorporate
significant assumptions that are not evidenced by
prices from observable current market transactions in
the same instrument, and are not based on
observable market data:
• the table details the total change in fair value
of these instruments; it does not isolate the
component of the change that is attributable
to the unobservable component;
• instruments valued with significant
unobservable inputs are frequently dynamically
managed with instruments valued using
observable inputs; the table does not include any
changes in fair value of these latter instruments;
and
• the table reflects the full change in fair value
during 2008 of assets and liabilities valued using
significant unobservable inputs at 31 December
2008 which were observable at 31 December
2007.