HSBC 2008 Annual Report Download - page 129
Download and view the complete annual report
Please find page 129 of the 2008 HSBC annual report below. You can navigate through the pages in the report by either clicking on the pages listed below, or by using the keyword search tool below to find specific information within the annual report.-
 1
1 -
2
-
3
-
4
-
5
-
6
-
7
-
8
-
9
-
10
-
11
-
12
-
13
-
14
-
15
-
16
-
17
-
18
-
19
-
20
-
21
-
22
-
23
-
24
-
25
-
26
-
27
-
28
-
29
-
30
-
31
-
32
-
33
-
34
-
35
-
36
-
37
-
38
-
39
-
40
-
41
-
42
-
43
-
44
-
45
-
46
-
47
-
48
-
49
-
50
-
51
-
52
-
53
-
54
-
55
-
56
-
57
-
58
-
59
-
60
-
61
-
62
-
63
-
64
-
65
-
66
-
67
-
68
-
69
-
70
-
71
-
72
-
73
-
74
-
75
-
76
-
77
-
78
-
79
-
80
-
81
-
82
-
83
-
84
-
85
-
86
-
87
-
88
-
89
-
90
-
91
-
92
-
93
-
94
-
95
-
96
-
97
-
98
-
99
-
100
-
101
-
102
-
103
-
104
-
105
-
106
-
107
-
108
-
109
-
110
-
111
-
112
-
113
-
114
-
115
-
116
-
117
-
118
-
 119
119 -
 120
120 -
 121
121 -
 122
122 -
 123
123 -
 124
124 -
 125
125 -
 126
126 -
 127
127 -
 128
128 -
 129
129 -
 130
130 -
 131
131 -
 132
132 -
 133
133 -
 134
134 -
 135
135 -
 136
136 -
 137
137 -
 138
138 -
 139
139 -
140
-
141
-
142
-
143
-
144
-
145
-
146
-
147
-
148
-
149
-
150
-
151
-
152
-
153
-
154
-
155
-
156
-
157
-
158
-
159
-
160
-
161
-
162
-
163
-
164
-
165
-
166
-
167
-
168
-
169
-
170
-
171
-
172
-
173
-
174
-
175
-
176
-
177
-
178
-
179
-
180
-
181
-
182
-
183
-
184
-
185
-
186
-
187
-
188
-
189
-
190
-
191
-
192
-
193
-
194
-
195
-
196
-
197
-
198
-
199
-
200
-
201
-
202
-
203
-
204
-
205
-
206
-
207
-
208
-
209
-
210
-
211
-
212
-
213
-
214
-
215
-
216
-
217
-
218
-
219
-
220
-
221
-
222
-
223
-
224
-
225
-
226
-
227
-
228
-
229
-
230
-
231
-
232
-
233
-
234
-
235
-
236
-
237
-
238
-
239
-
240
-
241
-
242
-
243
-
244
-
245
-
246
-
247
-
248
-
249
-
250
-
251
-
252
-
253
-
254
-
255
-
256
-
257
-
258
-
259
-
260
-
261
-
262
-
263
-
264
-
265
-
266
-
267
-
268
-
269
-
270
-
271
-
272
-
273
-
274
-
275
-
276
-
277
-
278
-
279
-
280
-
281
-
282
-
283
-
284
-
285
-
286
-
287
-
288
-
289
-
290
-
291
-
292
-
293
-
294
-
295
-
296
-
297
-
298
-
299
-
300
-
301
-
302
-
303
-
304
-
305
-
306
-
307
-
308
-
309
-
310
-
311
-
312
-
313
-
314
-
315
-
316
-
317
-
318
-
319
-
320
-
321
-
322
-
323
-
324
-
325
-
326
-
327
-
328
-
329
-
330
-
331
-
332
-
333
-
334
-
335
-
336
-
337
-
338
-
339
-
340
-
341
-
342
-
343
-
344
-
345
-
346
-
347
-
348
-
349
-
350
-
351
-
352
-
353
-
354
-
355
-
356
-
357
-
358
-
359
-
360
-
361
-
362
-
363
-
364
-
365
-
366
-
367
-
368
-
369
-
370
-
371
-
372
-
373
-
374
-
375
-
376
-
377
-
378
-
379
-
380
-
381
-
382
-
383
-
384
-
385
-
386
-
387
-
388
-
389
-
390
-
391
-
392
-
393
-
394
-
395
-
396
-
397
-
398
-
399
-
400
-
401
-
402
-
403
-
404
-
405
-
406
-
407
-
408
-
409
-
410
-
411
-
412
-
413
-
414
-
415
-
416
-
417
-
418
-
419
-
420
-
421
-
422
-
423
-
424
-
425
-
426
-
427
-
428
-
429
-
430
-
431
-
432
-
433
-
434
-
435
-
436
-
437
-
438
-
439
-
440
-
441
-
442
-
443
-
444
-
445
-
446
-
447
-
448
-
449
-
450
-
451
-
452
-
453
-
454
-
455
-
456
-
457
-
458
-
459
-
460
-
461
-
462
-
463
-
464
-
465
-
466
-
467
-
468
-
469
-
470
-
471
-
472
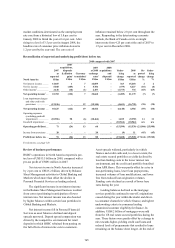
 |
 |

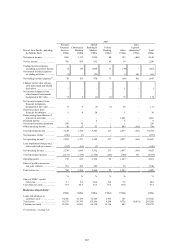
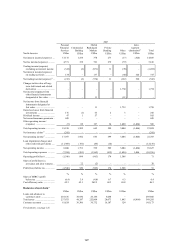
127
2007
North America
Personal
Financial
Services
US$m
Commercial
Banking
US$m
Global
Banking &
Markets
US$m
Private
Banking
US$m
Other
US$m
Inter-
segment
elimination21
US$m
Total
US$m
Net interest income/(expense) .... 13,175 1,558 378 273 (17) (520) 14,847
Net fee income/(expense) ........... 4,571 338 701 279 (79) – 5,810
Trading income/(expense)
excluding net interest income (349) (2) (871) 11 (78) – (1,289)
Net interest income/(expense)
on trading activities ................ 134 – 137 – (44) 520 747
Net trading income/(expense)16 .. (215) (2) (734) 11 (122) 520 (542)
Changes in fair value of long-
term debt issued and related
derivatives .............................. – – – – 1,750 – 1,750
Net income/(expense) from
other financial instruments
designated at fair value ........... – – 11 – (11) – –
Net income from financial
instruments designated at
fair value ................................. – – 11 – 1,739 – 1,750
Gains less losses from financial
investments ............................. 176 (1) 65 2 3 – 245
Dividend income ......................... 47 1 57 – – – 105
Net earned insurance premiums . 449 – – – – – 449
Other operating income/
(expense) ................................ (5) 88 167 34 1,480 (1,404) 360
Total operating income ............... 18,198 1,982 645 599 3,004 (1,404) 23,024
Net insurance claims17 ................ (241) – – – – – (241)
Net operating income5 ................ 17,957 1,982 645 599 3,004 (1,404) 22,783
Loan impairment charges and
other credit risk provisions ..... (11,909) (191) (46) (10) – – (12,156)
Net operating income ................. 6,048 1,791 599 589 3,004 (1,404) 10,627
Total operating expenses ............ (7,594) (893) (1,562) (415) (1,496) 1,404 (10,556)
Operating profit/(loss) ................ (1,546) 898 (963) 174 1,508 – 71
Share of profit/(loss) in
associates and joint ventures .. – 22 (2) – – – 20
Profit/(loss) before tax ................ (1,546) 920 (965) 174 1,508 – 91
% % % % % %
Share of HSBC’s profit
before tax ................................ (6.4) 3.8 (4.0) 0.7 6.3 0.4
Cost efficiency ratio ................... 42.3 45.1 242.2 69.3 49.8 46.3
Balance sheet data15
US$m US$m US$m US$m US$m US$m
Loans and advances to
customers (net) ....................... 218,676 38,930 26,186 6,068 – 289,860
Total assets ................................. 237,475 46,247 252,804 20,073 1,095 (8,409) 549,285
Customer accounts ...................... 61,824 36,306 30,732 16,187 124 145,173
For footnotes, see page 143.