HSBC 2008 Annual Report Download - page 280
Download and view the complete annual report
Please find page 280 of the 2008 HSBC annual report below. You can navigate through the pages in the report by either clicking on the pages listed below, or by using the keyword search tool below to find specific information within the annual report.-
 1
1 -
2
-
3
-
4
-
5
-
6
-
7
-
8
-
9
-
10
-
11
-
12
-
13
-
14
-
15
-
16
-
17
-
18
-
19
-
20
-
21
-
22
-
23
-
24
-
25
-
26
-
27
-
28
-
29
-
30
-
31
-
32
-
33
-
34
-
35
-
36
-
37
-
38
-
39
-
40
-
41
-
42
-
43
-
44
-
45
-
46
-
47
-
48
-
49
-
50
-
51
-
52
-
53
-
54
-
55
-
56
-
57
-
58
-
59
-
60
-
61
-
62
-
63
-
64
-
65
-
66
-
67
-
68
-
69
-
70
-
71
-
72
-
73
-
74
-
75
-
76
-
77
-
78
-
79
-
80
-
81
-
82
-
83
-
84
-
85
-
86
-
87
-
88
-
89
-
90
-
91
-
92
-
93
-
94
-
95
-
96
-
97
-
98
-
99
-
100
-
101
-
102
-
103
-
104
-
105
-
106
-
107
-
108
-
109
-
110
-
111
-
112
-
113
-
114
-
115
-
116
-
117
-
118
-
119
-
120
-
121
-
122
-
123
-
124
-
125
-
126
-
127
-
128
-
129
-
130
-
131
-
132
-
133
-
134
-
135
-
136
-
137
-
138
-
139
-
140
-
141
-
142
-
143
-
144
-
145
-
146
-
147
-
148
-
149
-
150
-
151
-
152
-
153
-
154
-
155
-
156
-
157
-
158
-
159
-
160
-
161
-
162
-
163
-
164
-
165
-
166
-
167
-
168
-
169
-
170
-
171
-
172
-
173
-
174
-
175
-
176
-
177
-
178
-
179
-
180
-
181
-
182
-
183
-
184
-
185
-
186
-
187
-
188
-
189
-
190
-
191
-
192
-
193
-
194
-
195
-
196
-
197
-
198
-
199
-
200
-
201
-
202
-
203
-
204
-
205
-
206
-
207
-
208
-
209
-
210
-
211
-
212
-
213
-
214
-
215
-
216
-
217
-
218
-
219
-
220
-
221
-
222
-
223
-
224
-
225
-
226
-
227
-
228
-
229
-
230
-
231
-
232
-
233
-
234
-
235
-
236
-
237
-
238
-
239
-
240
-
241
-
242
-
243
-
244
-
245
-
246
-
247
-
248
-
249
-
250
-
251
-
252
-
253
-
254
-
255
-
256
-
257
-
258
-
259
-
260
-
261
-
262
-
263
-
264
-
265
-
266
-
267
-
268
-
269
-
 270
270 -
 271
271 -
 272
272 -
 273
273 -
 274
274 -
 275
275 -
 276
276 -
 277
277 -
 278
278 -
 279
279 -
 280
280 -
 281
281 -
 282
282 -
 283
283 -
 284
284 -
 285
285 -
 286
286 -
 287
287 -
 288
288 -
 289
289 -
 290
290 -
291
-
292
-
293
-
294
-
295
-
296
-
297
-
298
-
299
-
300
-
301
-
302
-
303
-
304
-
305
-
306
-
307
-
308
-
309
-
310
-
311
-
312
-
313
-
314
-
315
-
316
-
317
-
318
-
319
-
320
-
321
-
322
-
323
-
324
-
325
-
326
-
327
-
328
-
329
-
330
-
331
-
332
-
333
-
334
-
335
-
336
-
337
-
338
-
339
-
340
-
341
-
342
-
343
-
344
-
345
-
346
-
347
-
348
-
349
-
350
-
351
-
352
-
353
-
354
-
355
-
356
-
357
-
358
-
359
-
360
-
361
-
362
-
363
-
364
-
365
-
366
-
367
-
368
-
369
-
370
-
371
-
372
-
373
-
374
-
375
-
376
-
377
-
378
-
379
-
380
-
381
-
382
-
383
-
384
-
385
-
386
-
387
-
388
-
389
-
390
-
391
-
392
-
393
-
394
-
395
-
396
-
397
-
398
-
399
-
400
-
401
-
402
-
403
-
404
-
405
-
406
-
407
-
408
-
409
-
410
-
411
-
412
-
413
-
414
-
415
-
416
-
417
-
418
-
419
-
420
-
421
-
422
-
423
-
424
-
425
-
426
-
427
-
428
-
429
-
430
-
431
-
432
-
433
-
434
-
435
-
436
-
437
-
438
-
439
-
440
-
441
-
442
-
443
-
444
-
445
-
446
-
447
-
448
-
449
-
450
-
451
-
452
-
453
-
454
-
455
-
456
-
457
-
458
-
459
-
460
-
461
-
462
-
463
-
464
-
465
-
466
-
467
-
468
-
469
-
470
-
471
-
472
 |
 |

HSBC HOLDINGS PLC
Report of the Directors: Risk (continued)
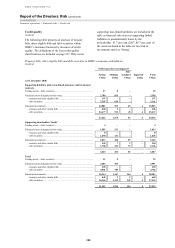
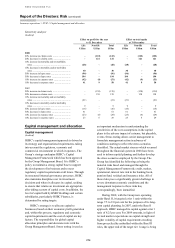
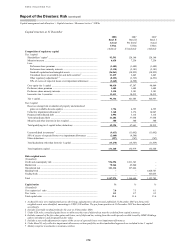
Capital management and allocation > Capital structure / Movement in tier 1 / RWAs
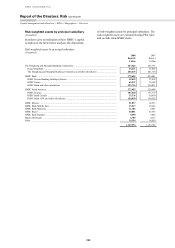
278
Capital structure at 31 December
2008
Basel II
Actual
2007
Basel II
Pro forma1
2007
Basel I
Actual
US$m US$m US$m
(Audited) (Unaudited) (Audited)
Composition of regulatory capital
Tier 1 capital
Shareholders’ equity2.................................................................................... 93,591 128,160 128,160
Minority interests .......................................................................................... 6,638 7,256 7,256
Less:
Preference share premium ........................................................................ (1,405) (1,405) (1,405)
Preference share minority interests .......................................................... (2,110) (2,181) (2,181)
Goodwill capitalised and intangible assets .............................................. (26,861) (38,855) (38,855)
Unrealised losses on available-for-sale debt securities3 .......................... 21,439 2,445 2,445
Other regulatory adjustments4, 5 ............................................................... (8,222) (3,325) (4,551)
50% of excess of expected losses over impairment allowances ............. (2,660) (4,508) –
Core equity tier 1 capital .............................................................................. 80,410 87,587 90,869
Preference share premium ............................................................................ 1,405 1,405 1,405
Preference share minority interests ............................................................... 2,110 2,181 2,181
Innovative tier 1 securities ........................................................................... 11,411 10,512 10,512
Tier 1 capital.................................................................................................. 95,336 101,685 104,967
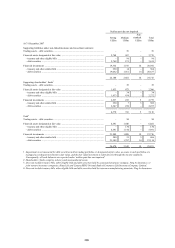
Tier 2 capital
Reserves arising from revaluation of property and unrealised
gains on available-for-sale equities .......................................................... 1,726 4,393 4,393
Collective impairment allowances6 .............................................................. 3,168 2,176 14,047
Perpetual subordinated debt ......................................................................... 2,996 3,114 3,114
Term subordinated debt ................................................................................ 41,204 37,658 37,658
Minority and other interests in tier 2 capital ................................................ 300 300 300
Total qualifying tier 2 capital before deductions ......................................... 49,394 47,641 59,512
Unconsolidated investments7 ....................................................................... (9,613) (11,092) (11,092)
50% of excess of expected losses over impairment allowances .................. (2,660) (4,508) –
Other deductions ........................................................................................... (997) (747) (747)
Total deductions other than from tier 1 capital ............................................ (13,270) (16,347) (11,839)
Total regulatory capital ................................................................................ 131,460 132,979 152,640
Risk-weighted assets
(Unaudited)
Credit and counterparty risk ............................................................................. 956,596 1,011,343 –
Market risk ........................................................................................................ 70,264 45,840 –
Operational risk ................................................................................................ 121,114 107,466 –
Banking book .................................................................................................... – – 1,020,747
Trading book ..................................................................................................... – – 103,035
Total .................................................................................................................. 1,147,974 1,164,649 1,123,782
Capital ratios % % %
(Unaudited)
Core equity tier 1 ratio ...................................................................................... 7.0 7.5 8.1
Tier 1 ratio ........................................................................................................ 8.3 8.7 9.3
Total capital ratio .............................................................................................. 11.4 11.4 13.6
1 As Basel II rules were implemented across the Group, adjustments to the previously published 31 December 2007 pro forma risk-
weighted assets were identified, amounting to US$35,198 million. The pro forma position at 31 December 2007 has been adjusted
accordingly.
2 Includes externally verified profits for the year to 31 December 2008.
3 Under FSA rules, unrealised gains/losses on debt securities net of deferred tax must be excluded from capital resources.
4 Includes removal of the fair value gains and losses, net of deferred tax, arising from the credit spreads on debt issued by HSBC Holdings
and its subsidiaries and designated at fair value.
5 Includes a tax credit adjustment in respect of the excess of expected losses over impairment allowances.
6 Under Basel II, only collective impairment allowances on loan portfolios on the standardised approach are included in tier 2 capital.
7 Mainly comprise investments in insurance entities.