HSBC 2008 Annual Report Download - page 31
Download and view the complete annual report
Please find page 31 of the 2008 HSBC annual report below. You can navigate through the pages in the report by either clicking on the pages listed below, or by using the keyword search tool below to find specific information within the annual report.-
 1
1 -
2
-
3
-
4
-
5
-
6
-
7
-
8
-
9
-
10
-
11
-
12
-
13
-
14
-
15
-
16
-
17
-
18
-
19
-
20
-
 21
21 -
 22
22 -
 23
23 -
 24
24 -
 25
25 -
 26
26 -
 27
27 -
 28
28 -
 29
29 -
 30
30 -
 31
31 -
 32
32 -
 33
33 -
 34
34 -
 35
35 -
 36
36 -
 37
37 -
 38
38 -
 39
39 -
 40
40 -
 41
41 -
42
-
43
-
44
-
45
-
46
-
47
-
48
-
49
-
50
-
51
-
52
-
53
-
54
-
55
-
56
-
57
-
58
-
59
-
60
-
61
-
62
-
63
-
64
-
65
-
66
-
67
-
68
-
69
-
70
-
71
-
72
-
73
-
74
-
75
-
76
-
77
-
78
-
79
-
80
-
81
-
82
-
83
-
84
-
85
-
86
-
87
-
88
-
89
-
90
-
91
-
92
-
93
-
94
-
95
-
96
-
97
-
98
-
99
-
100
-
101
-
102
-
103
-
104
-
105
-
106
-
107
-
108
-
109
-
110
-
111
-
112
-
113
-
114
-
115
-
116
-
117
-
118
-
119
-
120
-
121
-
122
-
123
-
124
-
125
-
126
-
127
-
128
-
129
-
130
-
131
-
132
-
133
-
134
-
135
-
136
-
137
-
138
-
139
-
140
-
141
-
142
-
143
-
144
-
145
-
146
-
147
-
148
-
149
-
150
-
151
-
152
-
153
-
154
-
155
-
156
-
157
-
158
-
159
-
160
-
161
-
162
-
163
-
164
-
165
-
166
-
167
-
168
-
169
-
170
-
171
-
172
-
173
-
174
-
175
-
176
-
177
-
178
-
179
-
180
-
181
-
182
-
183
-
184
-
185
-
186
-
187
-
188
-
189
-
190
-
191
-
192
-
193
-
194
-
195
-
196
-
197
-
198
-
199
-
200
-
201
-
202
-
203
-
204
-
205
-
206
-
207
-
208
-
209
-
210
-
211
-
212
-
213
-
214
-
215
-
216
-
217
-
218
-
219
-
220
-
221
-
222
-
223
-
224
-
225
-
226
-
227
-
228
-
229
-
230
-
231
-
232
-
233
-
234
-
235
-
236
-
237
-
238
-
239
-
240
-
241
-
242
-
243
-
244
-
245
-
246
-
247
-
248
-
249
-
250
-
251
-
252
-
253
-
254
-
255
-
256
-
257
-
258
-
259
-
260
-
261
-
262
-
263
-
264
-
265
-
266
-
267
-
268
-
269
-
270
-
271
-
272
-
273
-
274
-
275
-
276
-
277
-
278
-
279
-
280
-
281
-
282
-
283
-
284
-
285
-
286
-
287
-
288
-
289
-
290
-
291
-
292
-
293
-
294
-
295
-
296
-
297
-
298
-
299
-
300
-
301
-
302
-
303
-
304
-
305
-
306
-
307
-
308
-
309
-
310
-
311
-
312
-
313
-
314
-
315
-
316
-
317
-
318
-
319
-
320
-
321
-
322
-
323
-
324
-
325
-
326
-
327
-
328
-
329
-
330
-
331
-
332
-
333
-
334
-
335
-
336
-
337
-
338
-
339
-
340
-
341
-
342
-
343
-
344
-
345
-
346
-
347
-
348
-
349
-
350
-
351
-
352
-
353
-
354
-
355
-
356
-
357
-
358
-
359
-
360
-
361
-
362
-
363
-
364
-
365
-
366
-
367
-
368
-
369
-
370
-
371
-
372
-
373
-
374
-
375
-
376
-
377
-
378
-
379
-
380
-
381
-
382
-
383
-
384
-
385
-
386
-
387
-
388
-
389
-
390
-
391
-
392
-
393
-
394
-
395
-
396
-
397
-
398
-
399
-
400
-
401
-
402
-
403
-
404
-
405
-
406
-
407
-
408
-
409
-
410
-
411
-
412
-
413
-
414
-
415
-
416
-
417
-
418
-
419
-
420
-
421
-
422
-
423
-
424
-
425
-
426
-
427
-
428
-
429
-
430
-
431
-
432
-
433
-
434
-
435
-
436
-
437
-
438
-
439
-
440
-
441
-
442
-
443
-
444
-
445
-
446
-
447
-
448
-
449
-
450
-
451
-
452
-
453
-
454
-
455
-
456
-
457
-
458
-
459
-
460
-
461
-
462
-
463
-
464
-
465
-
466
-
467
-
468
-
469
-
470
-
471
-
472
 |
 |

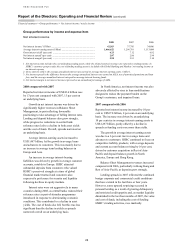
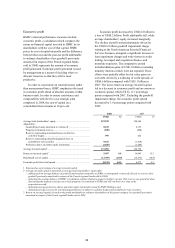
29
Net income from financial instruments designated at fair value
2008
US$m
2007
US$m
2006
US$m
Net income arising from:
– financial assets held to meet liabilities under insurance and
investment contracts ................................................................................ (5,064) 2,056 1,552
– liabilities to customers under investment contracts ................................ 1,751 (940) (1,008)
– HSBC’s long-term debt issued and related derivatives .......................... 6,679 2,812 (35)
– change in own credit spread on long-term debt ................................... 6,570 3,055 (388)
– other changes in fair value1 .................................................................. 109 (243) 353
– other instruments designated at fair value and related derivatives ......... 486 155 148
Net income from financial instruments designated at fair value .................... 3,852 4,083 657
Financial assets designated at fair value at 31 December ............................... 28,533 41,564 20,573
Financial liabilities designated at fair value at 31 December ......................... 74,587 89,939 70,211
1 Includes gains and losses arising from changes in the fair value of derivatives that are managed in conjunction with HSBC’s long-term
debt issued.
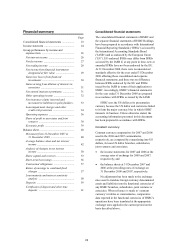
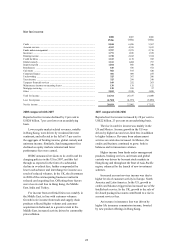
HSBC designates certain financial instruments
at fair value to remove or reduce accounting
mismatches in measurement or recognition, or where
financial instruments are managed and their
performance is evaluated together on a fair value
basis. All income and expense from financial
instruments designated at fair value are included in
this line except for interest arising from HSBC’s
issued debt securities and related derivatives
managed in conjunction with those debt securities,
which is recognised in ‘Interest expense’.
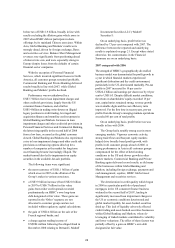
HSBC principally uses the fair value
designation in the following instances:
• for certain fixed-rate long-term debt issues
whose rate profile has been changed to floating
through interest rate swaps as part of a
documented interest rate management strategy.
Approximately US$59 billion (2007:
US$66 billion) of the Group’s debt issues have
been accounted for using the fair value option.
The movement in fair value of these debt issues
includes the effect of own credit spread changes
and any ineffectiveness in the economic
relationship between the related swaps and
own debt. As credit spreads widen or narrow,
accounting profits or losses are booked,
respectively. The size and direction of the
accounting consequences of changes in own
credit spread and ineffectiveness can be volatile
from year to year, but do not alter the cash flows
envisaged as part of the documented interest rate
management strategy; as a consequence of this,
gains and losses arising from changes in own
credit spread on long-term debt are not regarded
internally as part of managerial performance.
Similarly, such gains and losses are ignored in
the calculation of regulatory capital.
• for approximately US$11 billion (2007:
US$17 billion) of financial assets held to meet
liabilities under insurance contracts, and certain
liabilities under investment contracts with
discretionary participation features; and
• for approximately US$7 billion (2007:
US$14 billion) of financial assets held to meet
liabilities under unit-linked and other investment
contracts.
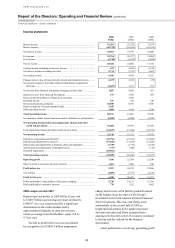
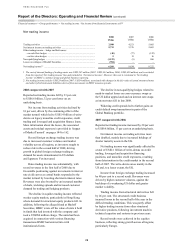
2008 compared with 2007
Reported net income from financial instruments
designated at fair value decreased by
US$231 million to US$3.9 billion in 2008.
Credit spreads widened significantly during the
year, leading to US$6.6 billion of positive fair value
movements on certain long-term debt issued by the
Group, compared with US$3.1 billion in 2007. These
fair value movements will fully reverse over the life
of the debt. The cumulative fair value adjustment at
31 December 2008 amounted to US$8.0 billion.
A negative movement of US$5.1 billion was
recorded in the fair value of assets held to back
insurance and investment contracts, compared with a
positive movement of US$2.1 billion in 2007. This
reflected investment losses driven by falling equity
and bond markets, predominantly affecting the value
of assets held in unit-linked and participating funds
in Hong Kong, France and the UK. The negative
movement in fair value is partially offset by a
corresponding reduction in ‘Net insurance claims
and movement in liabilities to policyholders’, where
unit-linked policyholders in particular participate in
the investment performance experienced on the
investment portfolios held to support the liabilities.