HSBC 2008 Annual Report Download - page 106
Download and view the complete annual report
Please find page 106 of the 2008 HSBC annual report below. You can navigate through the pages in the report by either clicking on the pages listed below, or by using the keyword search tool below to find specific information within the annual report.-
 1
1 -
2
-
3
-
4
-
5
-
6
-
7
-
8
-
9
-
10
-
11
-
12
-
13
-
14
-
15
-
16
-
17
-
18
-
19
-
20
-
21
-
22
-
23
-
24
-
25
-
26
-
27
-
28
-
29
-
30
-
31
-
32
-
33
-
34
-
35
-
36
-
37
-
38
-
39
-
40
-
41
-
42
-
43
-
44
-
45
-
46
-
47
-
48
-
49
-
50
-
51
-
52
-
53
-
54
-
55
-
56
-
57
-
58
-
59
-
60
-
61
-
62
-
63
-
64
-
65
-
66
-
67
-
68
-
69
-
70
-
71
-
72
-
73
-
74
-
75
-
76
-
77
-
78
-
79
-
80
-
81
-
82
-
83
-
84
-
85
-
86
-
87
-
88
-
89
-
90
-
91
-
92
-
93
-
94
-
95
-
 96
96 -
 97
97 -
 98
98 -
 99
99 -
 100
100 -
 101
101 -
 102
102 -
 103
103 -
 104
104 -
 105
105 -
 106
106 -
 107
107 -
 108
108 -
 109
109 -
 110
110 -
 111
111 -
 112
112 -
 113
113 -
 114
114 -
 115
115 -
 116
116 -
117
-
118
-
119
-
120
-
121
-
122
-
123
-
124
-
125
-
126
-
127
-
128
-
129
-
130
-
131
-
132
-
133
-
134
-
135
-
136
-
137
-
138
-
139
-
140
-
141
-
142
-
143
-
144
-
145
-
146
-
147
-
148
-
149
-
150
-
151
-
152
-
153
-
154
-
155
-
156
-
157
-
158
-
159
-
160
-
161
-
162
-
163
-
164
-
165
-
166
-
167
-
168
-
169
-
170
-
171
-
172
-
173
-
174
-
175
-
176
-
177
-
178
-
179
-
180
-
181
-
182
-
183
-
184
-
185
-
186
-
187
-
188
-
189
-
190
-
191
-
192
-
193
-
194
-
195
-
196
-
197
-
198
-
199
-
200
-
201
-
202
-
203
-
204
-
205
-
206
-
207
-
208
-
209
-
210
-
211
-
212
-
213
-
214
-
215
-
216
-
217
-
218
-
219
-
220
-
221
-
222
-
223
-
224
-
225
-
226
-
227
-
228
-
229
-
230
-
231
-
232
-
233
-
234
-
235
-
236
-
237
-
238
-
239
-
240
-
241
-
242
-
243
-
244
-
245
-
246
-
247
-
248
-
249
-
250
-
251
-
252
-
253
-
254
-
255
-
256
-
257
-
258
-
259
-
260
-
261
-
262
-
263
-
264
-
265
-
266
-
267
-
268
-
269
-
270
-
271
-
272
-
273
-
274
-
275
-
276
-
277
-
278
-
279
-
280
-
281
-
282
-
283
-
284
-
285
-
286
-
287
-
288
-
289
-
290
-
291
-
292
-
293
-
294
-
295
-
296
-
297
-
298
-
299
-
300
-
301
-
302
-
303
-
304
-
305
-
306
-
307
-
308
-
309
-
310
-
311
-
312
-
313
-
314
-
315
-
316
-
317
-
318
-
319
-
320
-
321
-
322
-
323
-
324
-
325
-
326
-
327
-
328
-
329
-
330
-
331
-
332
-
333
-
334
-
335
-
336
-
337
-
338
-
339
-
340
-
341
-
342
-
343
-
344
-
345
-
346
-
347
-
348
-
349
-
350
-
351
-
352
-
353
-
354
-
355
-
356
-
357
-
358
-
359
-
360
-
361
-
362
-
363
-
364
-
365
-
366
-
367
-
368
-
369
-
370
-
371
-
372
-
373
-
374
-
375
-
376
-
377
-
378
-
379
-
380
-
381
-
382
-
383
-
384
-
385
-
386
-
387
-
388
-
389
-
390
-
391
-
392
-
393
-
394
-
395
-
396
-
397
-
398
-
399
-
400
-
401
-
402
-
403
-
404
-
405
-
406
-
407
-
408
-
409
-
410
-
411
-
412
-
413
-
414
-
415
-
416
-
417
-
418
-
419
-
420
-
421
-
422
-
423
-
424
-
425
-
426
-
427
-
428
-
429
-
430
-
431
-
432
-
433
-
434
-
435
-
436
-
437
-
438
-
439
-
440
-
441
-
442
-
443
-
444
-
445
-
446
-
447
-
448
-
449
-
450
-
451
-
452
-
453
-
454
-
455
-
456
-
457
-
458
-
459
-
460
-
461
-
462
-
463
-
464
-
465
-
466
-
467
-
468
-
469
-
470
-
471
-
472
 |
 |

HSBC HOLDINGS PLC
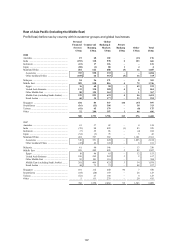
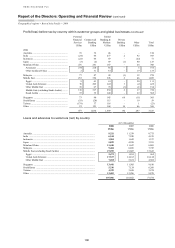
Report of the Directors: Operating and Financial Review (continued)
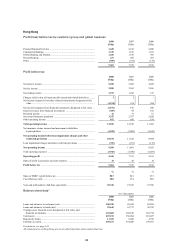
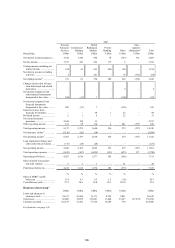
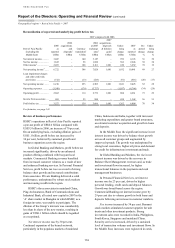
Geographical regions > Hong Kong > Profit/(loss) before tax by customer group
104
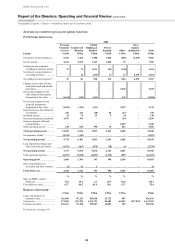
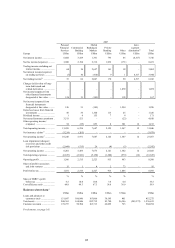
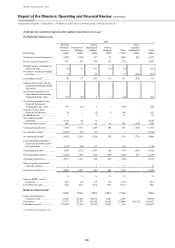
Analysis by customer group and global business
Profit/(loss) before tax
2008
Hong Kong
Personal
Financial
Services
US$m
Commercial
Banking
US$m
Global
Banking &
Markets
US$m
Private
Banking
US$m
Other
US$m
Inter-
segment
elimination21
US$m
Total
US$m
Net interest income/(expense)..... 3,381 1,498 1,524 214 (669) (250) 5,698
Net fee income ............................ 1,441 548 414 163 14 – 2,580
Trading income excluding net
interest income ....................... 143 79 483 120 30 – 855
Net interest/(expense) income
on trading activities ................ 11 1 244 –(168) 250 338
Net trading income/(expense)16 ... 154 80 727 120 (138) 250 1,193
Changes in fair value of long-
term debt issued and related
derivatives .............................. – – – – 3 – 3
Net income/(expense) from
other financial instruments
designated at fair value ........... (1,291) (10) 39 – 68 – (1,194)
Net income/(expense) from
financial instruments
designated at fair value ........... (1,291) (10) 39 – 71 – (1,191)
Gains less losses from
financial investments .............. 156 32 (109) – (388) – (309)
Dividend income ......................... 3 2 17 – 19 – 41
Net earned insurance
premiums ................................ 3,047 181 17 – 2 – 3,247
Other operating income .............. 132 38 101 8 906 (368) 817
Total operating income ............ 7,023 2,369 2,730 505 (183) (368) 12,076
Net insurance claims17 ................ (1,773) (136) (11) – (2) – (1,922)
Net operating income5 .............. 5,250 2,233 2,719 505 (185) (368) 10,154
Loan impairment (charges)/
recoveries and other credit
risk provisions ........................ (134) (335) (284) (13) 1 – (765)
Net operating income/(expense) 5,116 1,898 2,435 492 (184) (368) 9,389
Total operating expenses ............ (1,691) (584) (1,000) (255) (781) 368 (3,943)
Operating profit/(loss) .............. 3,425 1,314 1,435 237 (965) – 5,446
Share of profit in associates
and joint ventures ................... 3 1 1 – 10 – 15
Profit/(loss) before tax .............. 3,428 1,315 1,436 237 (955) – 5,461
% % % % % %
Share of HSBC’s profit
before tax ................................ 36.9 14.1 15.4 2.6 (10.3) 58.7
Cost efficiency ratio ................... 32.2 26.2 36.8 50.5 (422.2) 38.8
Balance sheet data15
US$m US$m US$m US$m US$m US$m
Loans and advances to
customers (net) ....................... 41,447 30,331 23,042 3,605 1,795 100,220
Total assets ................................. 75,419 36,428 225,853 28,800 66,192 (25,541) 407,151
Customer accounts ...................... 145,002 54,869 30,866 19,416 364 250,517
For footnotes, see page 143.