HSBC 2008 Annual Report Download - page 369
Download and view the complete annual report
Please find page 369 of the 2008 HSBC annual report below. You can navigate through the pages in the report by either clicking on the pages listed below, or by using the keyword search tool below to find specific information within the annual report.-
 1
1 -
2
-
3
-
4
-
5
-
6
-
7
-
8
-
9
-
10
-
11
-
12
-
13
-
14
-
15
-
16
-
17
-
18
-
19
-
20
-
21
-
22
-
23
-
24
-
25
-
26
-
27
-
28
-
29
-
30
-
31
-
32
-
33
-
34
-
35
-
36
-
37
-
38
-
39
-
40
-
41
-
42
-
43
-
44
-
45
-
46
-
47
-
48
-
49
-
50
-
51
-
52
-
53
-
54
-
55
-
56
-
57
-
58
-
59
-
60
-
61
-
62
-
63
-
64
-
65
-
66
-
67
-
68
-
69
-
70
-
71
-
72
-
73
-
74
-
75
-
76
-
77
-
78
-
79
-
80
-
81
-
82
-
83
-
84
-
85
-
86
-
87
-
88
-
89
-
90
-
91
-
92
-
93
-
94
-
95
-
96
-
97
-
98
-
99
-
100
-
101
-
102
-
103
-
104
-
105
-
106
-
107
-
108
-
109
-
110
-
111
-
112
-
113
-
114
-
115
-
116
-
117
-
118
-
119
-
120
-
121
-
122
-
123
-
124
-
125
-
126
-
127
-
128
-
129
-
130
-
131
-
132
-
133
-
134
-
135
-
136
-
137
-
138
-
139
-
140
-
141
-
142
-
143
-
144
-
145
-
146
-
147
-
148
-
149
-
150
-
151
-
152
-
153
-
154
-
155
-
156
-
157
-
158
-
159
-
160
-
161
-
162
-
163
-
164
-
165
-
166
-
167
-
168
-
169
-
170
-
171
-
172
-
173
-
174
-
175
-
176
-
177
-
178
-
179
-
180
-
181
-
182
-
183
-
184
-
185
-
186
-
187
-
188
-
189
-
190
-
191
-
192
-
193
-
194
-
195
-
196
-
197
-
198
-
199
-
200
-
201
-
202
-
203
-
204
-
205
-
206
-
207
-
208
-
209
-
210
-
211
-
212
-
213
-
214
-
215
-
216
-
217
-
218
-
219
-
220
-
221
-
222
-
223
-
224
-
225
-
226
-
227
-
228
-
229
-
230
-
231
-
232
-
233
-
234
-
235
-
236
-
237
-
238
-
239
-
240
-
241
-
242
-
243
-
244
-
245
-
246
-
247
-
248
-
249
-
250
-
251
-
252
-
253
-
254
-
255
-
256
-
257
-
258
-
259
-
260
-
261
-
262
-
263
-
264
-
265
-
266
-
267
-
268
-
269
-
270
-
271
-
272
-
273
-
274
-
275
-
276
-
277
-
278
-
279
-
280
-
281
-
282
-
283
-
284
-
285
-
286
-
287
-
288
-
289
-
290
-
291
-
292
-
293
-
294
-
295
-
296
-
297
-
298
-
299
-
300
-
301
-
302
-
303
-
304
-
305
-
306
-
307
-
308
-
309
-
310
-
311
-
312
-
313
-
314
-
315
-
316
-
317
-
318
-
319
-
320
-
321
-
322
-
323
-
324
-
325
-
326
-
327
-
328
-
329
-
330
-
331
-
332
-
333
-
334
-
335
-
336
-
337
-
338
-
339
-
340
-
341
-
342
-
343
-
344
-
345
-
346
-
347
-
348
-
349
-
350
-
351
-
352
-
353
-
354
-
355
-
356
-
357
-
358
-
 359
359 -
 360
360 -
 361
361 -
 362
362 -
 363
363 -
 364
364 -
 365
365 -
 366
366 -
 367
367 -
 368
368 -
 369
369 -
 370
370 -
 371
371 -
 372
372 -
 373
373 -
 374
374 -
 375
375 -
 376
376 -
 377
377 -
 378
378 -
 379
379 -
380
-
381
-
382
-
383
-
384
-
385
-
386
-
387
-
388
-
389
-
390
-
391
-
392
-
393
-
394
-
395
-
396
-
397
-
398
-
399
-
400
-
401
-
402
-
403
-
404
-
405
-
406
-
407
-
408
-
409
-
410
-
411
-
412
-
413
-
414
-
415
-
416
-
417
-
418
-
419
-
420
-
421
-
422
-
423
-
424
-
425
-
426
-
427
-
428
-
429
-
430
-
431
-
432
-
433
-
434
-
435
-
436
-
437
-
438
-
439
-
440
-
441
-
442
-
443
-
444
-
445
-
446
-
447
-
448
-
449
-
450
-
451
-
452
-
453
-
454
-
455
-
456
-
457
-
458
-
459
-
460
-
461
-
462
-
463
-
464
-
465
-
466
-
467
-
468
-
469
-
470
-
471
-
472
 |
 |

367
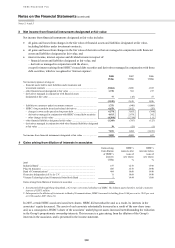
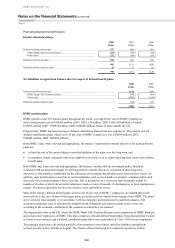
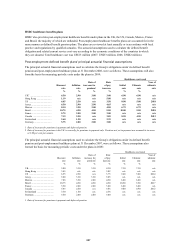
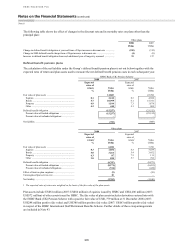
HSBC healthcare benefits plans
HSBC also provides post-employment healthcare benefits under plans in the UK, the US, Canada, Mexico, France
and Brazil, the majority of which are unfunded. Post-employment healthcare benefits plans are accounted for in the
same manner as defined benefit pension plans. The plans are reviewed at least annually or in accordance with local
practice and regulations by qualified actuaries. The actuarial assumptions used to calculate the defined benefit
obligation and related current service cost vary according to the economic conditions of the countries in which
they are situated. Total healthcare cost was US$13 million (2007: US$33 million; 2006: US$62 million).
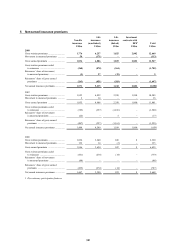
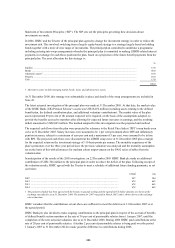
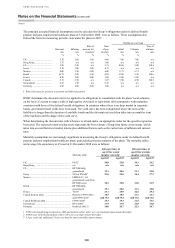
Post-employment defined benefit plans’ principal actuarial financial assumptions
The principal actuarial financial assumptions used to calculate the Group’s obligations under its defined benefit
pension and post-employment healthcare plans at 31 December 2008, were as follows. These assumptions will also
form the basis for measuring periodic costs under the plans in 2009:
Healthcare cost trend
Discount
rate
Inflation
rate
Rate of
increase for
pensions1
Rate
of pay
increase
Initial
rate
Ultimate
rate
Year of
ultimate
rate
% % % % % %
UK2 .................................... 6.50 2.90 3.00 3.40 6.90 6.90 n/a
Hong Kong ......................... 1.19 n/a n/a 5.00 n/a n/a n/a
US ...................................... 6.05 2.50 n/a 3.50 8.90 5.00 2018
Jersey .................................. 6.50 2.90 2.90 4.65 n/a n/a n/a
Mexico ............................... 8.10 3.50 2.00 4.50 6.75 6.75 n/a
Brazil .................................. 10.75 4.50 4.50 5.50 10.00 5.50 2018
France ................................. 5.75 2.00 2.00 3.00 n/a n/a n/a
Canada ............................... 7.19 2.50 n/a 3.85 8.20 4.90 2012
Switzerland ........................ 2.60 1.50 n/a 2.39 n/a n/a n/a
Germany ............................. 5.75 2.00 2.00 3.00 n/a n/a n/a
1 Rate of increase for pensions in payment and deferred pension.
2 Rate of increase for pensions in the UK is currently for pensions in payment only. Pensions not yet in payment are assumed to increase
at 2.80 per cent per annum.
The principal actuarial financial assumptions used to calculate the Group’s obligations under its defined benefit
pension and post-employment healthcare plans at 31 December 2007, were as follows. These assumptions also
formed the basis for measuring periodic costs under the plans in 2008:
Healthcare cost trend
Discount
rate
Inflation
rate
Rate of
increase for
pensions1
Rate
of pay
increase
Initial
rate
Ultimate
rate
Year of
ultimate
rate
% % % % % %
UK .........................................
.
5.80 3.30 3.30 4.30 7.30 7.30 n/a
Hong Kong ............................
.
3.45 n/a n/a 5.02 n/a n/a n/a
US .........................................
.
6.55 2.50 n/a 3.75 9.60 5.00 2014
Jersey .....................................
.
5.80 3.30 3.30 5.05 n/a n/a n/a
Mexico ..................................
.
7.88 3.50 2.00 4.50 6.00 6.00 n/a
Brazil .....................................
.
10.75 4.50 4.50 4.50 10.50 5.50 2017
France ....................................
.
5.50 2.00 2.00 3.00 6.00 6.00 n/a
Canada ..................................
.
5.43 2.50 n/a 3.86 9.00 4.90 2012
Switzerland ...........................
.
3.30 1.50 n/a 2.38 n/a n/a n/a
Germany ................................
.
5.50 2.00 2.00 3.00 n/a n/a n/a
1 Rate of increase for pensions in payment and deferred pension.