HSBC 2008 Annual Report Download - page 61
Download and view the complete annual report
Please find page 61 of the 2008 HSBC annual report below. You can navigate through the pages in the report by either clicking on the pages listed below, or by using the keyword search tool below to find specific information within the annual report.-
 1
1 -
2
-
3
-
4
-
5
-
6
-
7
-
8
-
9
-
10
-
11
-
12
-
13
-
14
-
15
-
16
-
17
-
18
-
19
-
20
-
21
-
22
-
23
-
24
-
25
-
26
-
27
-
28
-
29
-
30
-
31
-
32
-
33
-
34
-
35
-
36
-
37
-
38
-
39
-
40
-
41
-
42
-
43
-
44
-
45
-
46
-
47
-
48
-
49
-
50
-
 51
51 -
 52
52 -
 53
53 -
 54
54 -
 55
55 -
 56
56 -
 57
57 -
 58
58 -
 59
59 -
 60
60 -
 61
61 -
 62
62 -
 63
63 -
 64
64 -
 65
65 -
 66
66 -
 67
67 -
 68
68 -
 69
69 -
 70
70 -
 71
71 -
72
-
73
-
74
-
75
-
76
-
77
-
78
-
79
-
80
-
81
-
82
-
83
-
84
-
85
-
86
-
87
-
88
-
89
-
90
-
91
-
92
-
93
-
94
-
95
-
96
-
97
-
98
-
99
-
100
-
101
-
102
-
103
-
104
-
105
-
106
-
107
-
108
-
109
-
110
-
111
-
112
-
113
-
114
-
115
-
116
-
117
-
118
-
119
-
120
-
121
-
122
-
123
-
124
-
125
-
126
-
127
-
128
-
129
-
130
-
131
-
132
-
133
-
134
-
135
-
136
-
137
-
138
-
139
-
140
-
141
-
142
-
143
-
144
-
145
-
146
-
147
-
148
-
149
-
150
-
151
-
152
-
153
-
154
-
155
-
156
-
157
-
158
-
159
-
160
-
161
-
162
-
163
-
164
-
165
-
166
-
167
-
168
-
169
-
170
-
171
-
172
-
173
-
174
-
175
-
176
-
177
-
178
-
179
-
180
-
181
-
182
-
183
-
184
-
185
-
186
-
187
-
188
-
189
-
190
-
191
-
192
-
193
-
194
-
195
-
196
-
197
-
198
-
199
-
200
-
201
-
202
-
203
-
204
-
205
-
206
-
207
-
208
-
209
-
210
-
211
-
212
-
213
-
214
-
215
-
216
-
217
-
218
-
219
-
220
-
221
-
222
-
223
-
224
-
225
-
226
-
227
-
228
-
229
-
230
-
231
-
232
-
233
-
234
-
235
-
236
-
237
-
238
-
239
-
240
-
241
-
242
-
243
-
244
-
245
-
246
-
247
-
248
-
249
-
250
-
251
-
252
-
253
-
254
-
255
-
256
-
257
-
258
-
259
-
260
-
261
-
262
-
263
-
264
-
265
-
266
-
267
-
268
-
269
-
270
-
271
-
272
-
273
-
274
-
275
-
276
-
277
-
278
-
279
-
280
-
281
-
282
-
283
-
284
-
285
-
286
-
287
-
288
-
289
-
290
-
291
-
292
-
293
-
294
-
295
-
296
-
297
-
298
-
299
-
300
-
301
-
302
-
303
-
304
-
305
-
306
-
307
-
308
-
309
-
310
-
311
-
312
-
313
-
314
-
315
-
316
-
317
-
318
-
319
-
320
-
321
-
322
-
323
-
324
-
325
-
326
-
327
-
328
-
329
-
330
-
331
-
332
-
333
-
334
-
335
-
336
-
337
-
338
-
339
-
340
-
341
-
342
-
343
-
344
-
345
-
346
-
347
-
348
-
349
-
350
-
351
-
352
-
353
-
354
-
355
-
356
-
357
-
358
-
359
-
360
-
361
-
362
-
363
-
364
-
365
-
366
-
367
-
368
-
369
-
370
-
371
-
372
-
373
-
374
-
375
-
376
-
377
-
378
-
379
-
380
-
381
-
382
-
383
-
384
-
385
-
386
-
387
-
388
-
389
-
390
-
391
-
392
-
393
-
394
-
395
-
396
-
397
-
398
-
399
-
400
-
401
-
402
-
403
-
404
-
405
-
406
-
407
-
408
-
409
-
410
-
411
-
412
-
413
-
414
-
415
-
416
-
417
-
418
-
419
-
420
-
421
-
422
-
423
-
424
-
425
-
426
-
427
-
428
-
429
-
430
-
431
-
432
-
433
-
434
-
435
-
436
-
437
-
438
-
439
-
440
-
441
-
442
-
443
-
444
-
445
-
446
-
447
-
448
-
449
-
450
-
451
-
452
-
453
-
454
-
455
-
456
-
457
-
458
-
459
-
460
-
461
-
462
-
463
-
464
-
465
-
466
-
467
-
468
-
469
-
470
-
471
-
472
 |
 |

59
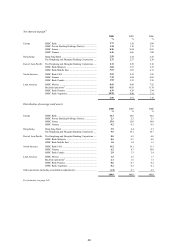
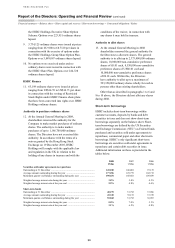
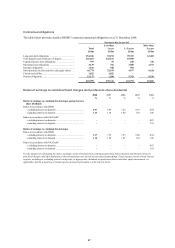
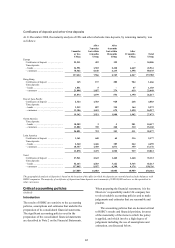
Deposits
The following tables summarise the average amount
of bank deposits, customer deposits and certificates
of deposit (‘CDs’) and other money market
instruments (which are included within ‘Debt
securities in issue’ in the balance sheet), together
with the average interest rates paid thereon for each
of the past three years. The geographical analysis of
average deposits is based on the location of the
office in which the deposits are recorded and
excludes balances with HSBC companies. The
‘Other’ category includes securities sold under
agreements to repurchase.
2008 2007 2006
Average
balance
Average
rate
Average
balance
Average
rate
Average
balance
Average
rate
US$m % US$m % US$m %
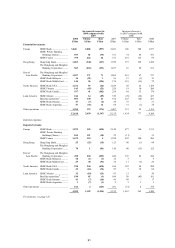
Deposits by banks
Europe
Demand and other – non-interest
bearing ................................................ 5,231 – 6,359 –
9,814 –
Demand – interest bearing ..................... 19,204 3.2 11,036 3.8 8,368 3.7
Time ........................................................ 43,695 3.9 38,470 4.7 27,447 4.0
Other ....................................................... 31,098 4.4 28,770 4.8 23,396 3.5
99,228 84,635 69,025
Hong Kong
Demand and other – non-interest
bearing ................................................ 1,375 – 1,331 –
1,031 –
Demand – interest bearing ..................... 2,780 2.0 2,420 4.3 2,428 4.6
Time ........................................................ 1,583 2.7 3,267 4.5 2,016 4.3
Other ....................................................... 178 3.4 251 0.4 362 3.3
5,916 7,269 5,837
Rest of Asia-Pacific
Demand and other – non-interest
bearing ................................................ 1,911 – 1,897 –
1,618 –
Demand – interest bearing ..................... 4,332 2.3 3,167 2.4 1,960 2.4
Time ........................................................ 10,342 3.5 6,433 5.1 3,645 4.8
Other ....................................................... 3,769 3.3 2,768 4.8 2,157 4.5
20,354 14,265 9,380
North America
Demand and other – non-interest
bearing ................................................ 761 – 827 –
767 –
Demand – interest bearing ..................... 5,684 1.7 3,759 4.8 3,033 5.3
Time ........................................................ 7,941 2.3 6,746 6.0 3,543 5.4
Other ....................................................... 449 1.6 169 7.1 699 5.6
14,835 11,501 8,042
Latin America
Demand and other – non-interest
bearing ................................................ 366 – 808 –
702 –
Demand – interest bearing ..................... 81 2.5 153 5.9 96 6.3
Time ........................................................ 3,357 5.6 2,690 6.5 1,732 5.5
Other ....................................................... 1,254 7.8 1,010 8.0 683 9.4
5,058 4,661 3,213
Total
Demand and other – non-interest
bearing ................................................ 9,644 – 11,222 –
13,932 –
Demand – interest bearing ..................... 32,081 2.7 20,535 3.8 15,885 4.5
Time ........................................................ 66,918 3.7 57,606 4.9 38,383 4.5
Other ....................................................... 36,748 4.5 32,968 5.0 27,297 3.9
145,391 122,331 95,497