HSBC 2008 Annual Report Download - page 122
Download and view the complete annual report
Please find page 122 of the 2008 HSBC annual report below. You can navigate through the pages in the report by either clicking on the pages listed below, or by using the keyword search tool below to find specific information within the annual report.-
 1
1 -
2
-
3
-
4
-
5
-
6
-
7
-
8
-
9
-
10
-
11
-
12
-
13
-
14
-
15
-
16
-
17
-
18
-
19
-
20
-
21
-
22
-
23
-
24
-
25
-
26
-
27
-
28
-
29
-
30
-
31
-
32
-
33
-
34
-
35
-
36
-
37
-
38
-
39
-
40
-
41
-
42
-
43
-
44
-
45
-
46
-
47
-
48
-
49
-
50
-
51
-
52
-
53
-
54
-
55
-
56
-
57
-
58
-
59
-
60
-
61
-
62
-
63
-
64
-
65
-
66
-
67
-
68
-
69
-
70
-
71
-
72
-
73
-
74
-
75
-
76
-
77
-
78
-
79
-
80
-
81
-
82
-
83
-
84
-
85
-
86
-
87
-
88
-
89
-
90
-
91
-
92
-
93
-
94
-
95
-
96
-
97
-
98
-
99
-
100
-
101
-
102
-
103
-
104
-
105
-
106
-
107
-
108
-
109
-
110
-
111
-
 112
112 -
 113
113 -
 114
114 -
 115
115 -
 116
116 -
 117
117 -
 118
118 -
 119
119 -
 120
120 -
 121
121 -
 122
122 -
 123
123 -
 124
124 -
 125
125 -
 126
126 -
 127
127 -
 128
128 -
 129
129 -
 130
130 -
 131
131 -
 132
132 -
133
-
134
-
135
-
136
-
137
-
138
-
139
-
140
-
141
-
142
-
143
-
144
-
145
-
146
-
147
-
148
-
149
-
150
-
151
-
152
-
153
-
154
-
155
-
156
-
157
-
158
-
159
-
160
-
161
-
162
-
163
-
164
-
165
-
166
-
167
-
168
-
169
-
170
-
171
-
172
-
173
-
174
-
175
-
176
-
177
-
178
-
179
-
180
-
181
-
182
-
183
-
184
-
185
-
186
-
187
-
188
-
189
-
190
-
191
-
192
-
193
-
194
-
195
-
196
-
197
-
198
-
199
-
200
-
201
-
202
-
203
-
204
-
205
-
206
-
207
-
208
-
209
-
210
-
211
-
212
-
213
-
214
-
215
-
216
-
217
-
218
-
219
-
220
-
221
-
222
-
223
-
224
-
225
-
226
-
227
-
228
-
229
-
230
-
231
-
232
-
233
-
234
-
235
-
236
-
237
-
238
-
239
-
240
-
241
-
242
-
243
-
244
-
245
-
246
-
247
-
248
-
249
-
250
-
251
-
252
-
253
-
254
-
255
-
256
-
257
-
258
-
259
-
260
-
261
-
262
-
263
-
264
-
265
-
266
-
267
-
268
-
269
-
270
-
271
-
272
-
273
-
274
-
275
-
276
-
277
-
278
-
279
-
280
-
281
-
282
-
283
-
284
-
285
-
286
-
287
-
288
-
289
-
290
-
291
-
292
-
293
-
294
-
295
-
296
-
297
-
298
-
299
-
300
-
301
-
302
-
303
-
304
-
305
-
306
-
307
-
308
-
309
-
310
-
311
-
312
-
313
-
314
-
315
-
316
-
317
-
318
-
319
-
320
-
321
-
322
-
323
-
324
-
325
-
326
-
327
-
328
-
329
-
330
-
331
-
332
-
333
-
334
-
335
-
336
-
337
-
338
-
339
-
340
-
341
-
342
-
343
-
344
-
345
-
346
-
347
-
348
-
349
-
350
-
351
-
352
-
353
-
354
-
355
-
356
-
357
-
358
-
359
-
360
-
361
-
362
-
363
-
364
-
365
-
366
-
367
-
368
-
369
-
370
-
371
-
372
-
373
-
374
-
375
-
376
-
377
-
378
-
379
-
380
-
381
-
382
-
383
-
384
-
385
-
386
-
387
-
388
-
389
-
390
-
391
-
392
-
393
-
394
-
395
-
396
-
397
-
398
-
399
-
400
-
401
-
402
-
403
-
404
-
405
-
406
-
407
-
408
-
409
-
410
-
411
-
412
-
413
-
414
-
415
-
416
-
417
-
418
-
419
-
420
-
421
-
422
-
423
-
424
-
425
-
426
-
427
-
428
-
429
-
430
-
431
-
432
-
433
-
434
-
435
-
436
-
437
-
438
-
439
-
440
-
441
-
442
-
443
-
444
-
445
-
446
-
447
-
448
-
449
-
450
-
451
-
452
-
453
-
454
-
455
-
456
-
457
-
458
-
459
-
460
-
461
-
462
-
463
-
464
-
465
-
466
-
467
-
468
-
469
-
470
-
471
-
472
 |
 |

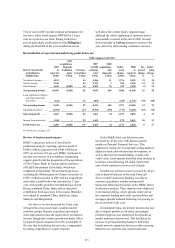
HSBC HOLDINGS PLC
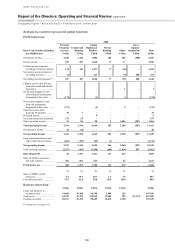
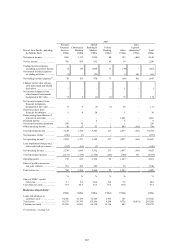
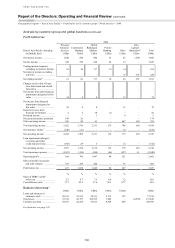
Report of the Directors: Operating and Financial Review (continued)
Geographical regions > North America > 2008
120
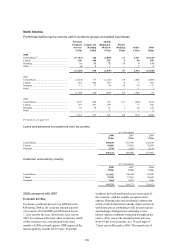
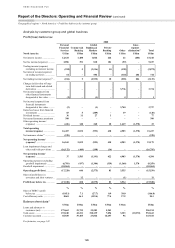
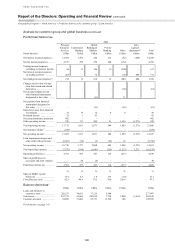
Profit/(loss) before tax
2008 2007 2006
North America US$m US$m US$m
Net interest income .......................................................................................... 15,218 14,847 14,268
Net fee income ................................................................................................. 5,227 5,810 4,766
Net trading income/(expense) ......................................................................... (3,135) (542) 1,358
Changes in fair value of long-term debt issued and related derivatives ......... 3,736 1,750 (63)
Net income from other financial instruments designated at fair value ........... 1– –
Net income/(expense) from financial instruments designated at fair value ... 3,737 1,750 (63)
Gains less losses from financial investments .................................................. (120) 245 58
Dividend income .............................................................................................. 77 105 85
Net earned insurance premiums ...................................................................... 390 449 492
Other operating income ................................................................................... 23 360 922
Total operating income ................................................................................. 21,417 23,024 21,886
Net insurance claims incurred and movement in liabilities
to policyholders............................................................................................ (238) (241) (259)
Net operating income before loan impairment charges and other
credit risk provisions ................................................................................. 21,179 22,783 21,627
Loan impairment charges and other credit risk provisions ............................. (16,795) (12,156) (6,796)
Net operating income .................................................................................... 4,384 10,627 14,831
Operating expenses (excluding goodwill impairment) ................................... (9,359) (10,556) (10,193)
Goodwill impairment ....................................................................................... (10,564) – –
Operating profit/(loss).................................................................................... (15,539) 71 4,638
Share of profit in associates and joint ventures ............................................... 11 20 30
Profit/(loss) before tax ................................................................................... (15,528) 91 4,668
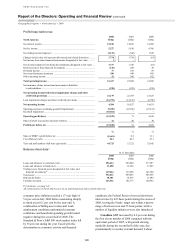
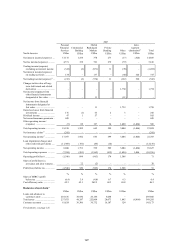
%
%
%
Share of HSBC’s profit before tax .................................................................. (166.8)
0.4
21.1
Cost efficiency ratio ........................................................................................ 94.1
46.3
47.1
Year-end staff numbers (full-time equivalent) ................................................ 44,725 52,722 55,642
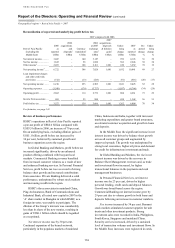
Balance sheet data15
At 31 December
2008 2007 2006
US$m US$m US$m
Loans and advances to customers (net) ........................................................... 256,214 289,860 277,987
Loans and advances to banks (net) .................................................................. 11,458 16,566 17,865
Trading assets, financial assets designated at fair value, and
financial investments20 ................................................................................ 119,634 133,998 145,700
Total assets ...................................................................................................... 552,612 549,285 505,638
Deposits by banks ............................................................................................ 18,181 16,618 11,484
Customer accounts ........................................................................................... 143,532 145,173 120,922
For footnotes, see page 143.
All commentaries on North America are on an underlying basis unless stated otherwise.
consumer price inflation reached a 17-year high of
5.6 per cent in July 2008 before moderating sharply
to stand at just 0.1 per cent by the year-end. A
combination of falling asset values and weak
employment conditions undermined consumer
confidence and household spending growth turned
negative during the second half of 2008. The
Standard & Poor’s S&P 500 stock market index fell
by 38 per cent during the year. Faced with this
deterioration in economic activity and financial
conditions, the Federal Reserve lowered short-term
interest rates by 425 basis points during the course of
2008, leaving the Funds’ target rate within a narrow
range of between zero and 25 basis points, while a
number of liquidity initiatives were also introduced.
Canadian GDP increased by 0.4 per cent during
the first eleven months of 2008 compared with the
equivalent period of 2007, with growth slowing
markedly during the second half of the year, due
predominantly to weaker external demand. Labour