HSBC 2008 Annual Report Download - page 100
Download and view the complete annual report
Please find page 100 of the 2008 HSBC annual report below. You can navigate through the pages in the report by either clicking on the pages listed below, or by using the keyword search tool below to find specific information within the annual report.-
 1
1 -
2
-
3
-
4
-
5
-
6
-
7
-
8
-
9
-
10
-
11
-
12
-
13
-
14
-
15
-
16
-
17
-
18
-
19
-
20
-
21
-
22
-
23
-
24
-
25
-
26
-
27
-
28
-
29
-
30
-
31
-
32
-
33
-
34
-
35
-
36
-
37
-
38
-
39
-
40
-
41
-
42
-
43
-
44
-
45
-
46
-
47
-
48
-
49
-
50
-
51
-
52
-
53
-
54
-
55
-
56
-
57
-
58
-
59
-
60
-
61
-
62
-
63
-
64
-
65
-
66
-
67
-
68
-
69
-
70
-
71
-
72
-
73
-
74
-
75
-
76
-
77
-
78
-
79
-
80
-
81
-
82
-
83
-
84
-
85
-
86
-
87
-
88
-
89
-
 90
90 -
 91
91 -
 92
92 -
 93
93 -
 94
94 -
 95
95 -
 96
96 -
 97
97 -
 98
98 -
 99
99 -
 100
100 -
 101
101 -
 102
102 -
 103
103 -
 104
104 -
 105
105 -
 106
106 -
 107
107 -
 108
108 -
 109
109 -
 110
110 -
111
-
112
-
113
-
114
-
115
-
116
-
117
-
118
-
119
-
120
-
121
-
122
-
123
-
124
-
125
-
126
-
127
-
128
-
129
-
130
-
131
-
132
-
133
-
134
-
135
-
136
-
137
-
138
-
139
-
140
-
141
-
142
-
143
-
144
-
145
-
146
-
147
-
148
-
149
-
150
-
151
-
152
-
153
-
154
-
155
-
156
-
157
-
158
-
159
-
160
-
161
-
162
-
163
-
164
-
165
-
166
-
167
-
168
-
169
-
170
-
171
-
172
-
173
-
174
-
175
-
176
-
177
-
178
-
179
-
180
-
181
-
182
-
183
-
184
-
185
-
186
-
187
-
188
-
189
-
190
-
191
-
192
-
193
-
194
-
195
-
196
-
197
-
198
-
199
-
200
-
201
-
202
-
203
-
204
-
205
-
206
-
207
-
208
-
209
-
210
-
211
-
212
-
213
-
214
-
215
-
216
-
217
-
218
-
219
-
220
-
221
-
222
-
223
-
224
-
225
-
226
-
227
-
228
-
229
-
230
-
231
-
232
-
233
-
234
-
235
-
236
-
237
-
238
-
239
-
240
-
241
-
242
-
243
-
244
-
245
-
246
-
247
-
248
-
249
-
250
-
251
-
252
-
253
-
254
-
255
-
256
-
257
-
258
-
259
-
260
-
261
-
262
-
263
-
264
-
265
-
266
-
267
-
268
-
269
-
270
-
271
-
272
-
273
-
274
-
275
-
276
-
277
-
278
-
279
-
280
-
281
-
282
-
283
-
284
-
285
-
286
-
287
-
288
-
289
-
290
-
291
-
292
-
293
-
294
-
295
-
296
-
297
-
298
-
299
-
300
-
301
-
302
-
303
-
304
-
305
-
306
-
307
-
308
-
309
-
310
-
311
-
312
-
313
-
314
-
315
-
316
-
317
-
318
-
319
-
320
-
321
-
322
-
323
-
324
-
325
-
326
-
327
-
328
-
329
-
330
-
331
-
332
-
333
-
334
-
335
-
336
-
337
-
338
-
339
-
340
-
341
-
342
-
343
-
344
-
345
-
346
-
347
-
348
-
349
-
350
-
351
-
352
-
353
-
354
-
355
-
356
-
357
-
358
-
359
-
360
-
361
-
362
-
363
-
364
-
365
-
366
-
367
-
368
-
369
-
370
-
371
-
372
-
373
-
374
-
375
-
376
-
377
-
378
-
379
-
380
-
381
-
382
-
383
-
384
-
385
-
386
-
387
-
388
-
389
-
390
-
391
-
392
-
393
-
394
-
395
-
396
-
397
-
398
-
399
-
400
-
401
-
402
-
403
-
404
-
405
-
406
-
407
-
408
-
409
-
410
-
411
-
412
-
413
-
414
-
415
-
416
-
417
-
418
-
419
-
420
-
421
-
422
-
423
-
424
-
425
-
426
-
427
-
428
-
429
-
430
-
431
-
432
-
433
-
434
-
435
-
436
-
437
-
438
-
439
-
440
-
441
-
442
-
443
-
444
-
445
-
446
-
447
-
448
-
449
-
450
-
451
-
452
-
453
-
454
-
455
-
456
-
457
-
458
-
459
-
460
-
461
-
462
-
463
-
464
-
465
-
466
-
467
-
468
-
469
-
470
-
471
-
472
 |
 |

HSBC HOLDINGS PLC
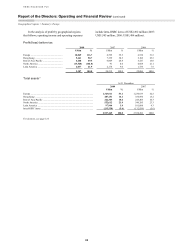
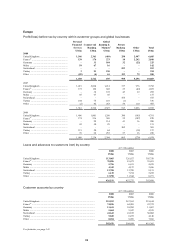
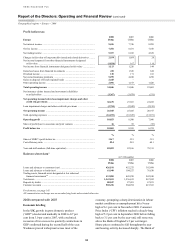
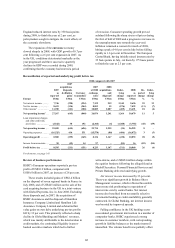
Report of the Directors: Operating and Financial Review (continued)
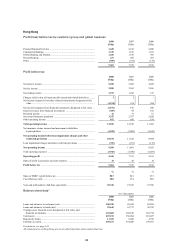
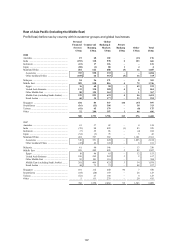
Geographical regions > Europe > Profit/(loss) before tax by customer group // Hong Kong
98
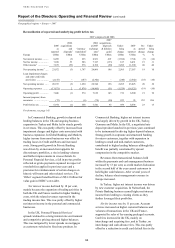
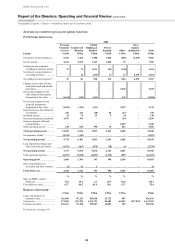
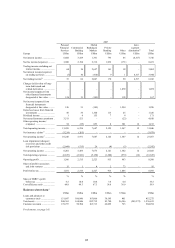
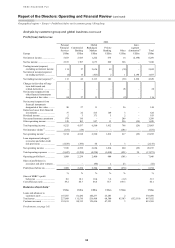
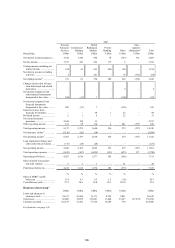
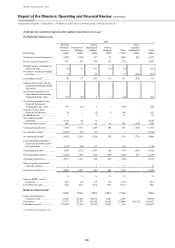
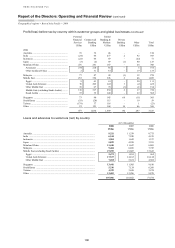
Analysis by customer group and global business (continued)
Profit/(loss) before tax
2006
Europe
Personal
Financial
Services
US$m
Commercial
Banking
US$m
Global
Banking &
Markets
US$m
Private
Banking
US$m
Other
US$m
Inter-
segment
elimination21
US$m
Total
US$m
Net interest income ..................... 5,653 2,923 1,222 675 14 (2,198) 8,289
Net fee income ............................ 2,533 1,707 1,673 869 326 – 7,108
Trading income/(expense)
excluding net interest income 119 27 2,636 99 (39) – 2,842
Net interest income/(expense)
on trading activities ................ (6) 15 (523) 2 1 2,198 1,687
Net trading income/(expense)16 .. 113 42 2,113 101 (38) 2,198 4,529
Changes in fair value of long-
term debt issued and
related derivatives .................. – – – – 28 – 28
Net income/(expense) from
other financial instruments
designated at fair value ........... 80 27 11 – (2) – 116
Net income/(expense) from
financial instruments
designated at fair value ........... 80 27 11 – 26 – 144
Gains less losses from financial
investments ............................. 37 22 413 149 3 – 624
Dividend income ......................... 2 3 171 5 2 – 183
Net earned insurance premiums . 979 110 – – 209 – 1,298
Other operating income .............. 128 103 957 13 256 (29) 1,428
Total operating income ............... 9,525 4,937 6,560 1,812 798 (29) 23,603
Net insurance claims17 ................ (331) (19) – – (181) – (531)
Net operating income5 ................ 9,194 4,918 6,560 1,812 617 (29) 23,072
Loan impairment (charges)/
recoveries and other credit
risk provisions ........................ (1,838) (386) 64 2 3 – (2,155)
Net operating income ................. 7,356 4,532 6,624 1,814 620 (29) 20,917
Total operating expenses ............ (5,447) (2,298) (4,224) (1,010) (921) 29 (13,871)
Operating profit/(loss) ................ 1,909 2,234 2,400 804 (301) – 7,046
Share of profit/(loss) in
associates and joint ventures .. – – (96) 1 23 – (72)
Profit/(loss) before tax ................ 1,909 2,234 2,304 805 (278) – 6,974
% % % % % %
Share of HSBC’s profit
before tax ................................ 8.6 10.1 10.4 3.6 (1.2) 31.5
Cost efficiency ratio .................... 59.2 46.7 64.4 55.7 149.3 60.1
Balance sheet data15
US$m US$m US$m US$m US$m US$m
Loans and advances to
customers (net) ....................... 147,507 81,430 140,277 23,283 2 392,499
Total assets .................................. 227,609 111,510 526,468 68,380 85,183 (152,118) 867,032
Customer accounts ...................... 152,411 80,312 139,416 47,223 3 419,365
For footnotes, see page 143.