HSBC 2008 Annual Report Download - page 394
Download and view the complete annual report
Please find page 394 of the 2008 HSBC annual report below. You can navigate through the pages in the report by either clicking on the pages listed below, or by using the keyword search tool below to find specific information within the annual report.-
 1
1 -
2
-
3
-
4
-
5
-
6
-
7
-
8
-
9
-
10
-
11
-
12
-
13
-
14
-
15
-
16
-
17
-
18
-
19
-
20
-
21
-
22
-
23
-
24
-
25
-
26
-
27
-
28
-
29
-
30
-
31
-
32
-
33
-
34
-
35
-
36
-
37
-
38
-
39
-
40
-
41
-
42
-
43
-
44
-
45
-
46
-
47
-
48
-
49
-
50
-
51
-
52
-
53
-
54
-
55
-
56
-
57
-
58
-
59
-
60
-
61
-
62
-
63
-
64
-
65
-
66
-
67
-
68
-
69
-
70
-
71
-
72
-
73
-
74
-
75
-
76
-
77
-
78
-
79
-
80
-
81
-
82
-
83
-
84
-
85
-
86
-
87
-
88
-
89
-
90
-
91
-
92
-
93
-
94
-
95
-
96
-
97
-
98
-
99
-
100
-
101
-
102
-
103
-
104
-
105
-
106
-
107
-
108
-
109
-
110
-
111
-
112
-
113
-
114
-
115
-
116
-
117
-
118
-
119
-
120
-
121
-
122
-
123
-
124
-
125
-
126
-
127
-
128
-
129
-
130
-
131
-
132
-
133
-
134
-
135
-
136
-
137
-
138
-
139
-
140
-
141
-
142
-
143
-
144
-
145
-
146
-
147
-
148
-
149
-
150
-
151
-
152
-
153
-
154
-
155
-
156
-
157
-
158
-
159
-
160
-
161
-
162
-
163
-
164
-
165
-
166
-
167
-
168
-
169
-
170
-
171
-
172
-
173
-
174
-
175
-
176
-
177
-
178
-
179
-
180
-
181
-
182
-
183
-
184
-
185
-
186
-
187
-
188
-
189
-
190
-
191
-
192
-
193
-
194
-
195
-
196
-
197
-
198
-
199
-
200
-
201
-
202
-
203
-
204
-
205
-
206
-
207
-
208
-
209
-
210
-
211
-
212
-
213
-
214
-
215
-
216
-
217
-
218
-
219
-
220
-
221
-
222
-
223
-
224
-
225
-
226
-
227
-
228
-
229
-
230
-
231
-
232
-
233
-
234
-
235
-
236
-
237
-
238
-
239
-
240
-
241
-
242
-
243
-
244
-
245
-
246
-
247
-
248
-
249
-
250
-
251
-
252
-
253
-
254
-
255
-
256
-
257
-
258
-
259
-
260
-
261
-
262
-
263
-
264
-
265
-
266
-
267
-
268
-
269
-
270
-
271
-
272
-
273
-
274
-
275
-
276
-
277
-
278
-
279
-
280
-
281
-
282
-
283
-
284
-
285
-
286
-
287
-
288
-
289
-
290
-
291
-
292
-
293
-
294
-
295
-
296
-
297
-
298
-
299
-
300
-
301
-
302
-
303
-
304
-
305
-
306
-
307
-
308
-
309
-
310
-
311
-
312
-
313
-
314
-
315
-
316
-
317
-
318
-
319
-
320
-
321
-
322
-
323
-
324
-
325
-
326
-
327
-
328
-
329
-
330
-
331
-
332
-
333
-
334
-
335
-
336
-
337
-
338
-
339
-
340
-
341
-
342
-
343
-
344
-
345
-
346
-
347
-
348
-
349
-
350
-
351
-
352
-
353
-
354
-
355
-
356
-
357
-
358
-
359
-
360
-
361
-
362
-
363
-
364
-
365
-
366
-
367
-
368
-
369
-
370
-
371
-
372
-
373
-
374
-
375
-
376
-
377
-
378
-
379
-
380
-
381
-
382
-
383
-
 384
384 -
 385
385 -
 386
386 -
 387
387 -
 388
388 -
 389
389 -
 390
390 -
 391
391 -
 392
392 -
 393
393 -
 394
394 -
 395
395 -
 396
396 -
 397
397 -
 398
398 -
 399
399 -
 400
400 -
 401
401 -
 402
402 -
 403
403 -
 404
404 -
405
-
406
-
407
-
408
-
409
-
410
-
411
-
412
-
413
-
414
-
415
-
416
-
417
-
418
-
419
-
420
-
421
-
422
-
423
-
424
-
425
-
426
-
427
-
428
-
429
-
430
-
431
-
432
-
433
-
434
-
435
-
436
-
437
-
438
-
439
-
440
-
441
-
442
-
443
-
444
-
445
-
446
-
447
-
448
-
449
-
450
-
451
-
452
-
453
-
454
-
455
-
456
-
457
-
458
-
459
-
460
-
461
-
462
-
463
-
464
-
465
-
466
-
467
-
468
-
469
-
470
-
471
-
472
 |
 |

HSBC HOLDINGS PLC
Notes on the Financial Statements (continued)
Notes 14 and 15
392
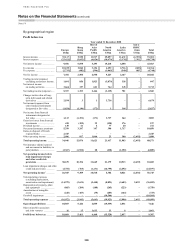
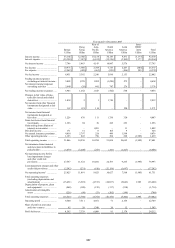
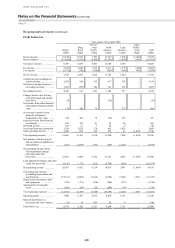
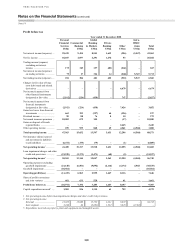
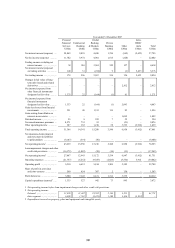
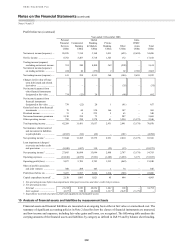
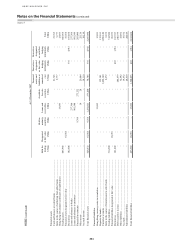
Profit before tax (continued)
Year ended 31 December 2006
Personal
Financial
Services
Commercial
Banking
Global
Banking
& Markets
Private
Banking Other
Intra-
HSBC
items
Total
US$m US$m US$m US$m US$m US$m US$m
Net interest income/(expense) .... 26,076 7,514 3,168 1,011 (625) (2,658) 34,486
Net fee income ............................ 8,762 3,207 3,718 1,323 172 – 17,182
Trading income/(expense)
excluding net interest income . 391 204 4,890 362 (228) – 5,619
Net interest income/(expense)
on trading activities ................ 220 20 (379) 2 82 2,658 2,603
Net trading income/(expense) ..... 611 224 4,511 364 (146) 2,658 8,222
Changes in fair value of long-
term debt issued and related
derivatives .............................. – – – – (35) – (35)
Net income/(expense) from
other financial instruments
designated at fair value ........... 739 (22) 20 1 (46) – 692
Net income/(expense) from
financial instruments
designated at fair value ........... 739 (22) 20 1 (81) – 657
Gains less losses from financial
investments ............................. 78 44 534 166 147 – 969
Dividend income ......................... 31 6 235 5 63 – 340
Net earned insurance premiums . 5,130 258 73 – 207 – 5,668
Other operating income .............. 782 250 1,378 61 3,254 (3,179) 2,546
Total operating income ............... 42,209 11,481 13,637 2,931 2,991 (3,179) 70,070
Net insurance claims incurred
and movement in liabilities
to policyholders ...................... (4,365) (96) (62) – (181) – (4,704)
Net operating income1 ................. 37,844 11,385 13,575 2,931 2,810 (3,179) 65,366
Loan impairment (charges)/
recoveries and other credit
risk provisions ........................ (9,949) (697) 119 (33) (13) – (10,573)
Net operating income2 ................ 27,895 10,688 13,694 2,898 2,797 (3,179) 54,793
Operating expenses ..................... (18,818) (4,979) (7,991) (1,685) (3,259) 3,179 (33,553)
Operating profit/(loss) ................ 9,077 5,709 5,703 1,213 (462) – 21,240
Share of profit in associates
and joint ventures ................... 380 288 103 1 74 – 846
Profit/(loss) before tax ................ 9,457 5,997 5,806 1,214 (388) – 22,086
Capital expenditure incurred3 ..... 2,150 1,083 1,021 45 684 – 4,983
1 Net operating income before loan impairment (charges)/recoveries and other credit risk provisions.
2 Net operating income:
External .................................. 23,238 9,692 20,034 1,661 168 – 54,793
Inter-segment .......................... 4,657 996 (6,340) 1,237 2,629 (3,179) –
3 Expenditure incurred on property, plant and equipment and intangible assets.
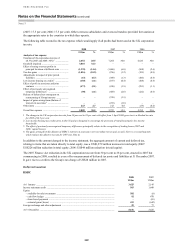
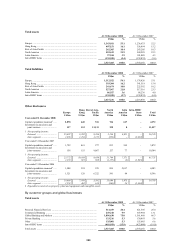
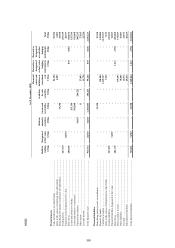
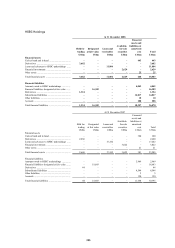
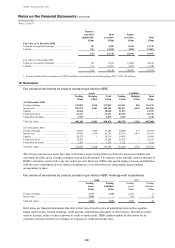
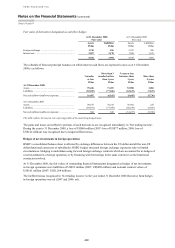
15 Analysis of financial assets and liabilities by measurement basis
Financial assets and financial liabilities are measured on an ongoing basis either at fair value or at amortised cost. The
summary of significant accounting policies in Note 2 describes how the classes of financial instruments are measured,
and how income and expenses, including fair value gains and losses, are recognised. The following table analyses the
carrying amounts of the financial assets and liabilities by category as defined in IAS 39 and by balance sheet heading.