HSBC 2008 Annual Report Download - page 412
Download and view the complete annual report
Please find page 412 of the 2008 HSBC annual report below. You can navigate through the pages in the report by either clicking on the pages listed below, or by using the keyword search tool below to find specific information within the annual report.-
 1
1 -
2
-
3
-
4
-
5
-
6
-
7
-
8
-
9
-
10
-
11
-
12
-
13
-
14
-
15
-
16
-
17
-
18
-
19
-
20
-
21
-
22
-
23
-
24
-
25
-
26
-
27
-
28
-
29
-
30
-
31
-
32
-
33
-
34
-
35
-
36
-
37
-
38
-
39
-
40
-
41
-
42
-
43
-
44
-
45
-
46
-
47
-
48
-
49
-
50
-
51
-
52
-
53
-
54
-
55
-
56
-
57
-
58
-
59
-
60
-
61
-
62
-
63
-
64
-
65
-
66
-
67
-
68
-
69
-
70
-
71
-
72
-
73
-
74
-
75
-
76
-
77
-
78
-
79
-
80
-
81
-
82
-
83
-
84
-
85
-
86
-
87
-
88
-
89
-
90
-
91
-
92
-
93
-
94
-
95
-
96
-
97
-
98
-
99
-
100
-
101
-
102
-
103
-
104
-
105
-
106
-
107
-
108
-
109
-
110
-
111
-
112
-
113
-
114
-
115
-
116
-
117
-
118
-
119
-
120
-
121
-
122
-
123
-
124
-
125
-
126
-
127
-
128
-
129
-
130
-
131
-
132
-
133
-
134
-
135
-
136
-
137
-
138
-
139
-
140
-
141
-
142
-
143
-
144
-
145
-
146
-
147
-
148
-
149
-
150
-
151
-
152
-
153
-
154
-
155
-
156
-
157
-
158
-
159
-
160
-
161
-
162
-
163
-
164
-
165
-
166
-
167
-
168
-
169
-
170
-
171
-
172
-
173
-
174
-
175
-
176
-
177
-
178
-
179
-
180
-
181
-
182
-
183
-
184
-
185
-
186
-
187
-
188
-
189
-
190
-
191
-
192
-
193
-
194
-
195
-
196
-
197
-
198
-
199
-
200
-
201
-
202
-
203
-
204
-
205
-
206
-
207
-
208
-
209
-
210
-
211
-
212
-
213
-
214
-
215
-
216
-
217
-
218
-
219
-
220
-
221
-
222
-
223
-
224
-
225
-
226
-
227
-
228
-
229
-
230
-
231
-
232
-
233
-
234
-
235
-
236
-
237
-
238
-
239
-
240
-
241
-
242
-
243
-
244
-
245
-
246
-
247
-
248
-
249
-
250
-
251
-
252
-
253
-
254
-
255
-
256
-
257
-
258
-
259
-
260
-
261
-
262
-
263
-
264
-
265
-
266
-
267
-
268
-
269
-
270
-
271
-
272
-
273
-
274
-
275
-
276
-
277
-
278
-
279
-
280
-
281
-
282
-
283
-
284
-
285
-
286
-
287
-
288
-
289
-
290
-
291
-
292
-
293
-
294
-
295
-
296
-
297
-
298
-
299
-
300
-
301
-
302
-
303
-
304
-
305
-
306
-
307
-
308
-
309
-
310
-
311
-
312
-
313
-
314
-
315
-
316
-
317
-
318
-
319
-
320
-
321
-
322
-
323
-
324
-
325
-
326
-
327
-
328
-
329
-
330
-
331
-
332
-
333
-
334
-
335
-
336
-
337
-
338
-
339
-
340
-
341
-
342
-
343
-
344
-
345
-
346
-
347
-
348
-
349
-
350
-
351
-
352
-
353
-
354
-
355
-
356
-
357
-
358
-
359
-
360
-
361
-
362
-
363
-
364
-
365
-
366
-
367
-
368
-
369
-
370
-
371
-
372
-
373
-
374
-
375
-
376
-
377
-
378
-
379
-
380
-
381
-
382
-
383
-
384
-
385
-
386
-
387
-
388
-
389
-
390
-
391
-
392
-
393
-
394
-
395
-
396
-
397
-
398
-
399
-
400
-
401
-
 402
402 -
 403
403 -
 404
404 -
 405
405 -
 406
406 -
 407
407 -
 408
408 -
 409
409 -
 410
410 -
 411
411 -
 412
412 -
 413
413 -
 414
414 -
 415
415 -
 416
416 -
 417
417 -
 418
418 -
 419
419 -
 420
420 -
 421
421 -
 422
422 -
423
-
424
-
425
-
426
-
427
-
428
-
429
-
430
-
431
-
432
-
433
-
434
-
435
-
436
-
437
-
438
-
439
-
440
-
441
-
442
-
443
-
444
-
445
-
446
-
447
-
448
-
449
-
450
-
451
-
452
-
453
-
454
-
455
-
456
-
457
-
458
-
459
-
460
-
461
-
462
-
463
-
464
-
465
-
466
-
467
-
468
-
469
-
470
-
471
-
472
 |
 |

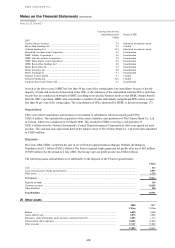
HSBC HOLDINGS PLC
Notes on the Financial Statements (continued)
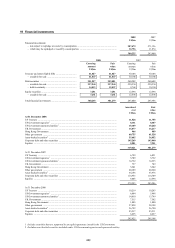
Note 22
410
Basis of the recoverable amount – value in use or fair value less costs to sell
The recoverable amount of all CGUs to which goodwill has been allocated was equal to its value in use (‘VIU’) at
each respective testing date for 2007 and 2008.
For each significant CGU, the VIU is calculated by discounting management’s cash flow projections for each CGU.
The pre-tax discount rate used is based on the cost of capital HSBC allocates to investments in the countries within
which the CGU operates. The long-term growth rate is used to extrapolate the cash flows in perpetuity because of the
long-term perspective within the Group of the business units making up the CGUs. However, due to the economic
downturn in Personal Financial Services – North America, a 10 year cash flow projection was used.
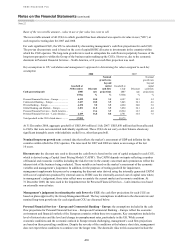
Key assumptions in VIU calculation and management’s approach to determining the values assigned to each key
assumption
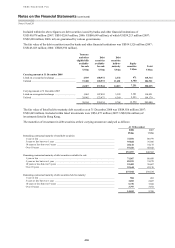
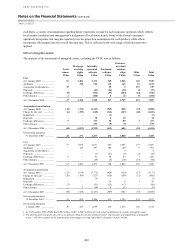
2008 2007
Cash-generating unit
Goodwill at
31 December
2008
Discount
rate
Nominal
growth rate
beyond
initial
cash flow
projections
Goodwill at
1 July
2007
Discount
rate
Nominal
growth rate
beyond
initial
cash flow
projections
US$m % % US$m % %
Personal Financial Services – Europe ............... 4,422 10.0 3.5 4,197 10.3 5.2
Commercial Banking – Europe ......................... 3,427 10.0 3.5 3,045 10.1 4.6
Private Banking – Europe .................................. 4,470 9.0 3.5 4,694 10.0 3.8
Global Banking and Markets – Europe ............. 3,451 11.0 3.5 3,894 10.1 4.4
Personal Financial Services – North America ... – 13.6 3.9 10,564 12.3 4.0
Personal Financial Services – Latin America .... 2,189 16.8 8.8 2,781 16.4 7.8
Total goodwill in the CGUs listed above .......... 17,959 29,175
At 31 December 2008, aggregate goodwill of US$3,896 million (1 July 2007: US$3,850 million) had been allocated
to CGUs that were not considered individually significant. These CGUs do not carry on their balance sheets any
significant intangible assets with indefinite useful lives, other than goodwill.
Nominal long-term growth rate: external data that reflects the market’s assessment of GDP and inflation for the
countries within which the CGU operates. The rates used for 2007 and 2008 are taken as an average of the last
10 years.
Discount rate: the discount rate used to discount the cash flows is based on the cost of capital assigned to each CGU,
which is derived using a Capital Asset Pricing Model (‘CAPM’). The CAPM depends on inputs reflecting a number
of financial and economic variables including the risk-free rate in the country concerned and a premium to reflect the
inherent risk of the business being evaluated. These variables are based on the market’s assessment of the economic
variables and management’s judgement. In addition, for the purposes of testing goodwill for impairment,
management supplements this process by comparing the discount rates derived using the internally generated CAPM
with cost of capital rates produced by external sources. HSBC uses the externally-sourced cost of capital rates where,
in management’s judgement, those rates reflect more accurately the current market and economic conditions. At
31 December 2008, the rates used in the impairment test for Personal Financial Services – Latin America was based
on externally sourced rates.
Management’s judgement in estimating the cash flows of a CGU: the cash flow projections for each CGU are
based on plans approved by the Group Management Board. The key assumptions in addition to the discount rate and
nominal long-term growth rate for each significant CGU are discussed below.
Personal Financial Services – Europe and Commercial Banking – Europe: the assumptions included in the cash
flow projections for Personal Financial Services – Europe and Commercial Banking – Europe reflect the economic
environment and financial outlook of the European countries within these two segments. Key assumptions include the
level of interest rates and the level and change in unemployment rates, particularly in the UK. While current
economic conditions and the economic outlook in Europe remain challenging, management’s cash flow projections
are based on these prevailing conditions. Despite the severity of the conditions at the balance sheet date, management
does not expect these conditions to continue over the longer term. The downside risks to this assessment include the