HSBC 2008 Annual Report Download - page 388
Download and view the complete annual report
Please find page 388 of the 2008 HSBC annual report below. You can navigate through the pages in the report by either clicking on the pages listed below, or by using the keyword search tool below to find specific information within the annual report.-
 1
1 -
2
-
3
-
4
-
5
-
6
-
7
-
8
-
9
-
10
-
11
-
12
-
13
-
14
-
15
-
16
-
17
-
18
-
19
-
20
-
21
-
22
-
23
-
24
-
25
-
26
-
27
-
28
-
29
-
30
-
31
-
32
-
33
-
34
-
35
-
36
-
37
-
38
-
39
-
40
-
41
-
42
-
43
-
44
-
45
-
46
-
47
-
48
-
49
-
50
-
51
-
52
-
53
-
54
-
55
-
56
-
57
-
58
-
59
-
60
-
61
-
62
-
63
-
64
-
65
-
66
-
67
-
68
-
69
-
70
-
71
-
72
-
73
-
74
-
75
-
76
-
77
-
78
-
79
-
80
-
81
-
82
-
83
-
84
-
85
-
86
-
87
-
88
-
89
-
90
-
91
-
92
-
93
-
94
-
95
-
96
-
97
-
98
-
99
-
100
-
101
-
102
-
103
-
104
-
105
-
106
-
107
-
108
-
109
-
110
-
111
-
112
-
113
-
114
-
115
-
116
-
117
-
118
-
119
-
120
-
121
-
122
-
123
-
124
-
125
-
126
-
127
-
128
-
129
-
130
-
131
-
132
-
133
-
134
-
135
-
136
-
137
-
138
-
139
-
140
-
141
-
142
-
143
-
144
-
145
-
146
-
147
-
148
-
149
-
150
-
151
-
152
-
153
-
154
-
155
-
156
-
157
-
158
-
159
-
160
-
161
-
162
-
163
-
164
-
165
-
166
-
167
-
168
-
169
-
170
-
171
-
172
-
173
-
174
-
175
-
176
-
177
-
178
-
179
-
180
-
181
-
182
-
183
-
184
-
185
-
186
-
187
-
188
-
189
-
190
-
191
-
192
-
193
-
194
-
195
-
196
-
197
-
198
-
199
-
200
-
201
-
202
-
203
-
204
-
205
-
206
-
207
-
208
-
209
-
210
-
211
-
212
-
213
-
214
-
215
-
216
-
217
-
218
-
219
-
220
-
221
-
222
-
223
-
224
-
225
-
226
-
227
-
228
-
229
-
230
-
231
-
232
-
233
-
234
-
235
-
236
-
237
-
238
-
239
-
240
-
241
-
242
-
243
-
244
-
245
-
246
-
247
-
248
-
249
-
250
-
251
-
252
-
253
-
254
-
255
-
256
-
257
-
258
-
259
-
260
-
261
-
262
-
263
-
264
-
265
-
266
-
267
-
268
-
269
-
270
-
271
-
272
-
273
-
274
-
275
-
276
-
277
-
278
-
279
-
280
-
281
-
282
-
283
-
284
-
285
-
286
-
287
-
288
-
289
-
290
-
291
-
292
-
293
-
294
-
295
-
296
-
297
-
298
-
299
-
300
-
301
-
302
-
303
-
304
-
305
-
306
-
307
-
308
-
309
-
310
-
311
-
312
-
313
-
314
-
315
-
316
-
317
-
318
-
319
-
320
-
321
-
322
-
323
-
324
-
325
-
326
-
327
-
328
-
329
-
330
-
331
-
332
-
333
-
334
-
335
-
336
-
337
-
338
-
339
-
340
-
341
-
342
-
343
-
344
-
345
-
346
-
347
-
348
-
349
-
350
-
351
-
352
-
353
-
354
-
355
-
356
-
357
-
358
-
359
-
360
-
361
-
362
-
363
-
364
-
365
-
366
-
367
-
368
-
369
-
370
-
371
-
372
-
373
-
374
-
375
-
376
-
377
-
 378
378 -
 379
379 -
 380
380 -
 381
381 -
 382
382 -
 383
383 -
 384
384 -
 385
385 -
 386
386 -
 387
387 -
 388
388 -
 389
389 -
 390
390 -
 391
391 -
 392
392 -
 393
393 -
 394
394 -
 395
395 -
 396
396 -
 397
397 -
 398
398 -
399
-
400
-
401
-
402
-
403
-
404
-
405
-
406
-
407
-
408
-
409
-
410
-
411
-
412
-
413
-
414
-
415
-
416
-
417
-
418
-
419
-
420
-
421
-
422
-
423
-
424
-
425
-
426
-
427
-
428
-
429
-
430
-
431
-
432
-
433
-
434
-
435
-
436
-
437
-
438
-
439
-
440
-
441
-
442
-
443
-
444
-
445
-
446
-
447
-
448
-
449
-
450
-
451
-
452
-
453
-
454
-
455
-
456
-
457
-
458
-
459
-
460
-
461
-
462
-
463
-
464
-
465
-
466
-
467
-
468
-
469
-
470
-
471
-
472
 |
 |

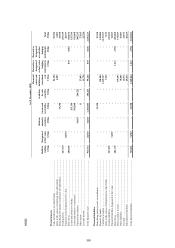
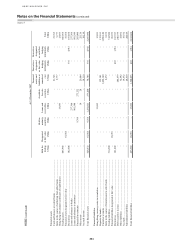
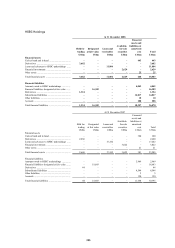
HSBC HOLDINGS PLC
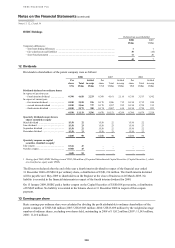
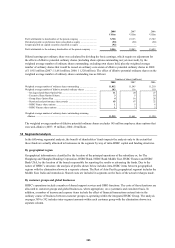
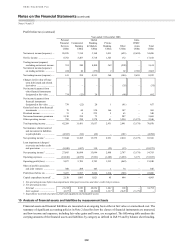
Notes on the Financial Statements (continued)
Note 14
386
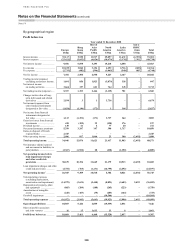
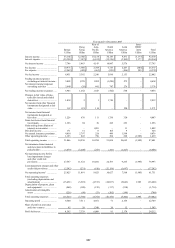
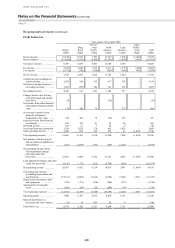
By geographical region
Profit before tax
Year ended 31 December 2008
Europe
Hong
Kong
Rest of
Asia-
Pacific
North
America
Latin
America
Intra-
HSBC
items Total
US$m US$m US$m US$m US$m US$m US$m
Interest income ............................ 35,117 9,530 11,517 25,897 11,632 (2,392) 91,301
Interest expense .......................... (25,421) (3,832) (6,024) (10,679) (5,174) 2,392 (48,738)
Net interest income ..................... 9,696 5,698 5,493 15,218 6,458 – 42,563
Fee income .................................. 10,225 3,062 3,154 6,292 2,716 (685) 24,764
Fee expense ................................. (2,733) (482) (596) (1,065) (549) 685 (4,740)
Net fee income ............................ 7,492 2,580 2,558 5,227 2,167 – 20,024
Trading income/(expense)
excluding net interest income . 1,691 856 1,823 (3,879) 356 – 847
Net interest income
on trading activities ................ 3,666 337 621 744 345 – 5,713
Net trading income/(expense) ..... 5,357 1,193 2,444 (3,135) 701 – 6,560
Changes in fair value of long-
term debt issued and related
derivatives .............................. 2,939 3 1 3,736 – – 6,679
Net income/(expense) from
other financial instruments
designated at fair value ........... (1,826) (1,194) (172) 1 364 – (2,827)
Net income from financial
instruments designated at
fair value ................................. 1,113 (1,191) (171) 3,737 364 – 3,852
Gains less losses from financial
investments ............................. 418 (309) 32 (120) 176 – 197
Dividend income ......................... 130 41 4 77 20 – 272
Net earned insurance premiums . 5,299 3,247 197 390 1,717 – 10,850
Gains on disposal of French
regional banks ........................ 2,445 – – – – – 2,445
Other operating income .............. 2,096 817 1,064 23 300 (2,492) 1,808
Total operating income ............ 34,046 12,076 11,621 21,417 11,903 (2,492) 88,571
Net insurance claims incurred
and movement in liabilities to
policyholders .......................... (3,367) (1,922) 28 (238) (1,390) – (6,889)
Net operating income before
loan impairment charges
and other credit risk
provisions .............................. 30,679 10,154 11,649 21,179 10,513 (2,492) 81,682
Loan impairment charges and othe
r
credit risk provisions .............. (3,754) (765) (1,131) (16,795) (2,492) – (24,937)
Net operating income1 .............. 26,925 9,389 10,518 4,384 8,021 (2,492) 56,745
Total operating expenses
(excluding depreciation,
amortisation and impairment) (14,979) (3,631) (5,440) (8,891) (5,603) 2,492 (36,052)
Depreciation of property, plant
and equipment ........................ (865) (209) (188) (265) (223) – (1,750)
Amortisation of intangible
assets ....................................... (228) (103) (35) (203) (164) – (733)
Goodwill impairment .................. – – – (10,564) – – (10,564)
Total operating expenses .......... (16,072) (3,943) (5,663) (19,923) (5,990) 2,492 (49,099)
Operating profit/(loss) .............. 10,853 5,446 4,855 (15,539) 2,031 – 7,646
Share of profit in associates
and joint ventures ................... 16 15 1,613 11 6 – 1,661
Profit/(loss) before tax .............. 10,869 5,461 6,468 (15,528) 2,037 – 9,307