HSBC 2008 Annual Report Download - page 27
Download and view the complete annual report
Please find page 27 of the 2008 HSBC annual report below. You can navigate through the pages in the report by either clicking on the pages listed below, or by using the keyword search tool below to find specific information within the annual report.-
 1
1 -
2
-
3
-
4
-
5
-
6
-
7
-
8
-
9
-
10
-
11
-
12
-
13
-
14
-
15
-
16
-
 17
17 -
 18
18 -
 19
19 -
 20
20 -
 21
21 -
 22
22 -
 23
23 -
 24
24 -
 25
25 -
 26
26 -
 27
27 -
 28
28 -
 29
29 -
 30
30 -
 31
31 -
 32
32 -
 33
33 -
 34
34 -
 35
35 -
 36
36 -
 37
37 -
38
-
39
-
40
-
41
-
42
-
43
-
44
-
45
-
46
-
47
-
48
-
49
-
50
-
51
-
52
-
53
-
54
-
55
-
56
-
57
-
58
-
59
-
60
-
61
-
62
-
63
-
64
-
65
-
66
-
67
-
68
-
69
-
70
-
71
-
72
-
73
-
74
-
75
-
76
-
77
-
78
-
79
-
80
-
81
-
82
-
83
-
84
-
85
-
86
-
87
-
88
-
89
-
90
-
91
-
92
-
93
-
94
-
95
-
96
-
97
-
98
-
99
-
100
-
101
-
102
-
103
-
104
-
105
-
106
-
107
-
108
-
109
-
110
-
111
-
112
-
113
-
114
-
115
-
116
-
117
-
118
-
119
-
120
-
121
-
122
-
123
-
124
-
125
-
126
-
127
-
128
-
129
-
130
-
131
-
132
-
133
-
134
-
135
-
136
-
137
-
138
-
139
-
140
-
141
-
142
-
143
-
144
-
145
-
146
-
147
-
148
-
149
-
150
-
151
-
152
-
153
-
154
-
155
-
156
-
157
-
158
-
159
-
160
-
161
-
162
-
163
-
164
-
165
-
166
-
167
-
168
-
169
-
170
-
171
-
172
-
173
-
174
-
175
-
176
-
177
-
178
-
179
-
180
-
181
-
182
-
183
-
184
-
185
-
186
-
187
-
188
-
189
-
190
-
191
-
192
-
193
-
194
-
195
-
196
-
197
-
198
-
199
-
200
-
201
-
202
-
203
-
204
-
205
-
206
-
207
-
208
-
209
-
210
-
211
-
212
-
213
-
214
-
215
-
216
-
217
-
218
-
219
-
220
-
221
-
222
-
223
-
224
-
225
-
226
-
227
-
228
-
229
-
230
-
231
-
232
-
233
-
234
-
235
-
236
-
237
-
238
-
239
-
240
-
241
-
242
-
243
-
244
-
245
-
246
-
247
-
248
-
249
-
250
-
251
-
252
-
253
-
254
-
255
-
256
-
257
-
258
-
259
-
260
-
261
-
262
-
263
-
264
-
265
-
266
-
267
-
268
-
269
-
270
-
271
-
272
-
273
-
274
-
275
-
276
-
277
-
278
-
279
-
280
-
281
-
282
-
283
-
284
-
285
-
286
-
287
-
288
-
289
-
290
-
291
-
292
-
293
-
294
-
295
-
296
-
297
-
298
-
299
-
300
-
301
-
302
-
303
-
304
-
305
-
306
-
307
-
308
-
309
-
310
-
311
-
312
-
313
-
314
-
315
-
316
-
317
-
318
-
319
-
320
-
321
-
322
-
323
-
324
-
325
-
326
-
327
-
328
-
329
-
330
-
331
-
332
-
333
-
334
-
335
-
336
-
337
-
338
-
339
-
340
-
341
-
342
-
343
-
344
-
345
-
346
-
347
-
348
-
349
-
350
-
351
-
352
-
353
-
354
-
355
-
356
-
357
-
358
-
359
-
360
-
361
-
362
-
363
-
364
-
365
-
366
-
367
-
368
-
369
-
370
-
371
-
372
-
373
-
374
-
375
-
376
-
377
-
378
-
379
-
380
-
381
-
382
-
383
-
384
-
385
-
386
-
387
-
388
-
389
-
390
-
391
-
392
-
393
-
394
-
395
-
396
-
397
-
398
-
399
-
400
-
401
-
402
-
403
-
404
-
405
-
406
-
407
-
408
-
409
-
410
-
411
-
412
-
413
-
414
-
415
-
416
-
417
-
418
-
419
-
420
-
421
-
422
-
423
-
424
-
425
-
426
-
427
-
428
-
429
-
430
-
431
-
432
-
433
-
434
-
435
-
436
-
437
-
438
-
439
-
440
-
441
-
442
-
443
-
444
-
445
-
446
-
447
-
448
-
449
-
450
-
451
-
452
-
453
-
454
-
455
-
456
-
457
-
458
-
459
-
460
-
461
-
462
-
463
-
464
-
465
-
466
-
467
-
468
-
469
-
470
-
471
-
472
 |
 |
25
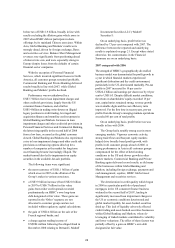
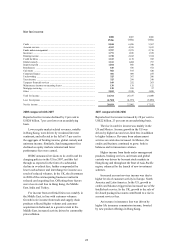
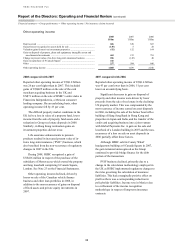
before tax of US$11.9 billion, broadly in line with
results excluding the dilution gains which arose in
2007 when HSBC did not participate in share
offerings by its mainland Chinese associates. Within
Asia, Global Banking and Markets’ results were
strongly ahead, driven by foreign exchange, Rates
and securities services. Balance Sheet Management
revenues rose significantly from positioning ahead
of interest rate cuts, and were especially strong in
Europe despite losses from the defaults of certain
financial sector companies.
With the exception of Personal Financial
Services, which incurred significant losses in North
America, all customer groups remained profitable.
Commercial Banking and Private Banking delivered
results broadly in line with 2007, while Global
Banking and Markets’ profits declined.
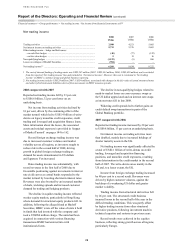
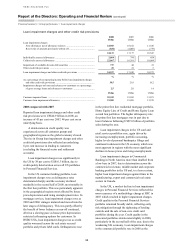
Performance was overshadowed by a
US$7.7 billion rise in loan impairment charges and
other credit risk provisions, largely from the US
consumer finance business, and a further
US$5.4 billion in trading write-downs on illiquid
legacy positions in credit trading, leveraged and
acquisition finance and monoline credit exposure in
Global Banking and Markets. Increases in loan
impairment charges and other credit risk provisions in
Personal Financial Services and Commercial Banking,
the latter rising rapidly in the second half of 2008
from a low base, occurred as the global economy
slowed. Global Banking and Markets also experienced
a rise in loan impairment charges and other credit risk
provisions as refinancing options dried up for a
number of companies as the market for long-term
asset financing became increasingly illiquid. The
market turmoil also led to impairments on equity
securities in the available-for-sale portfolio.
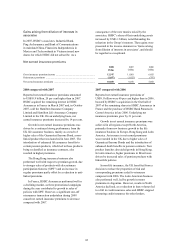
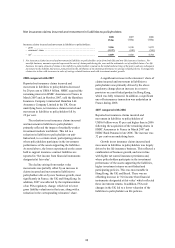
The following items were significant:
• the non-recurrence of US$1.1 billion of gains
which arose in 2007 on the dilution of the
Group’s stakes in various associates;
• a US$3.9 billion increase (from US$2.8 billion
in 2007 to US$6.7 billion) in fair value
gains from wider credit spreads recorded
predominantly on HSBC’s own long-term
debt designated at fair value. These gains are
reported in the ‘Other’ segment, are not
allocated to customer groups and are not
included within regulatory capital calculations;
• the gain of US$2.4 billion on the sale of the
French regional banks; and
• a charge against trading income of
US$984 million following the alleged fraud in
December 2008 relating to Bernard L Madoff
Investment Securities LLC (‘Madoff
Securities’).
On an underlying basis, profit before tax
declined by 73 per cent compared with 2007. The
difference between the reported and underlying
results is explained on page 21. Except where stated
otherwise, the commentaries in the Financial
Summary are on an underlying basis.
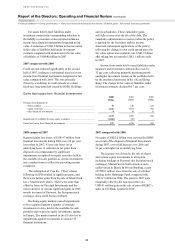
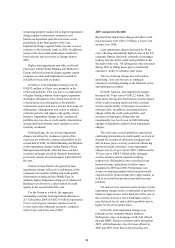
2007 compared with 2006
The strength of HSBC’s geographically diversified
business model was demonstrated by profit growth in
a year in which financial markets experienced
significant dislocation and the credit environment,
particularly in the US, deteriorated markedly. Pre-tax
profits in 2007 increased by 10 per cent to
US$24.2 billion and earnings per share rose by 18 per
cent to US$1.65. Despite difficult market conditions,
the return on shareholders’ equity exceeded 15 per
cent, capital ratios remained strong, revenue growth
was in double digits and the cost efficiency ratio
improved. For the first time in recent years, pre-tax
profits from the Group’s emerging markets operations
exceeded 60 per cent of total profits.
On an underlying basis, profit before tax was
broadly in line with 2006.
The Group had a notably strong year in most
emerging markets. Vigorous economic activity,
strong trade flows and buoyant equity markets
helped drive broadly based profit growth, with
profits in all customer groups ahead of 2006. A
strong performance in Asia in all customer groups
compensated for the effect of deteriorating
conditions in the US and slower growth in other
mature markets. Commercial Banking and Private
Banking again delivered record results, as did many
of the businesses within Global Banking and
Markets, including foreign exchange, payments and
cash management, equities, HSBC Global Asset
Management and securities services.
The deterioration in credit quality which began
in 2006 in a particular portfolio of purchased
mortgages in the US consumer finance business
widened in the second half of 2007, leading to
significantly increased loan impairment charges in
the US as economic conditions deteriorated and
global market liquidity for asset-backed securities
dried up. This lack of liquidity adversely affected
credit trading and asset-backed securities businesses
within Global Banking and Markets, where de-
leveraging of traded markets contributed to volatility
and lower valuations. The effect of these factors was
partially offset by a gain on HSBC’s own debt
designated at fair value.