HSBC 2008 Annual Report Download - page 168
Download and view the complete annual report
Please find page 168 of the 2008 HSBC annual report below. You can navigate through the pages in the report by either clicking on the pages listed below, or by using the keyword search tool below to find specific information within the annual report.-
 1
1 -
2
-
3
-
4
-
5
-
6
-
7
-
8
-
9
-
10
-
11
-
12
-
13
-
14
-
15
-
16
-
17
-
18
-
19
-
20
-
21
-
22
-
23
-
24
-
25
-
26
-
27
-
28
-
29
-
30
-
31
-
32
-
33
-
34
-
35
-
36
-
37
-
38
-
39
-
40
-
41
-
42
-
43
-
44
-
45
-
46
-
47
-
48
-
49
-
50
-
51
-
52
-
53
-
54
-
55
-
56
-
57
-
58
-
59
-
60
-
61
-
62
-
63
-
64
-
65
-
66
-
67
-
68
-
69
-
70
-
71
-
72
-
73
-
74
-
75
-
76
-
77
-
78
-
79
-
80
-
81
-
82
-
83
-
84
-
85
-
86
-
87
-
88
-
89
-
90
-
91
-
92
-
93
-
94
-
95
-
96
-
97
-
98
-
99
-
100
-
101
-
102
-
103
-
104
-
105
-
106
-
107
-
108
-
109
-
110
-
111
-
112
-
113
-
114
-
115
-
116
-
117
-
118
-
119
-
120
-
121
-
122
-
123
-
124
-
125
-
126
-
127
-
128
-
129
-
130
-
131
-
132
-
133
-
134
-
135
-
136
-
137
-
138
-
139
-
140
-
141
-
142
-
143
-
144
-
145
-
146
-
147
-
148
-
149
-
150
-
151
-
152
-
153
-
154
-
155
-
156
-
157
-
 158
158 -
 159
159 -
 160
160 -
 161
161 -
 162
162 -
 163
163 -
 164
164 -
 165
165 -
 166
166 -
 167
167 -
 168
168 -
 169
169 -
 170
170 -
 171
171 -
 172
172 -
 173
173 -
 174
174 -
 175
175 -
 176
176 -
 177
177 -
 178
178 -
179
-
180
-
181
-
182
-
183
-
184
-
185
-
186
-
187
-
188
-
189
-
190
-
191
-
192
-
193
-
194
-
195
-
196
-
197
-
198
-
199
-
200
-
201
-
202
-
203
-
204
-
205
-
206
-
207
-
208
-
209
-
210
-
211
-
212
-
213
-
214
-
215
-
216
-
217
-
218
-
219
-
220
-
221
-
222
-
223
-
224
-
225
-
226
-
227
-
228
-
229
-
230
-
231
-
232
-
233
-
234
-
235
-
236
-
237
-
238
-
239
-
240
-
241
-
242
-
243
-
244
-
245
-
246
-
247
-
248
-
249
-
250
-
251
-
252
-
253
-
254
-
255
-
256
-
257
-
258
-
259
-
260
-
261
-
262
-
263
-
264
-
265
-
266
-
267
-
268
-
269
-
270
-
271
-
272
-
273
-
274
-
275
-
276
-
277
-
278
-
279
-
280
-
281
-
282
-
283
-
284
-
285
-
286
-
287
-
288
-
289
-
290
-
291
-
292
-
293
-
294
-
295
-
296
-
297
-
298
-
299
-
300
-
301
-
302
-
303
-
304
-
305
-
306
-
307
-
308
-
309
-
310
-
311
-
312
-
313
-
314
-
315
-
316
-
317
-
318
-
319
-
320
-
321
-
322
-
323
-
324
-
325
-
326
-
327
-
328
-
329
-
330
-
331
-
332
-
333
-
334
-
335
-
336
-
337
-
338
-
339
-
340
-
341
-
342
-
343
-
344
-
345
-
346
-
347
-
348
-
349
-
350
-
351
-
352
-
353
-
354
-
355
-
356
-
357
-
358
-
359
-
360
-
361
-
362
-
363
-
364
-
365
-
366
-
367
-
368
-
369
-
370
-
371
-
372
-
373
-
374
-
375
-
376
-
377
-
378
-
379
-
380
-
381
-
382
-
383
-
384
-
385
-
386
-
387
-
388
-
389
-
390
-
391
-
392
-
393
-
394
-
395
-
396
-
397
-
398
-
399
-
400
-
401
-
402
-
403
-
404
-
405
-
406
-
407
-
408
-
409
-
410
-
411
-
412
-
413
-
414
-
415
-
416
-
417
-
418
-
419
-
420
-
421
-
422
-
423
-
424
-
425
-
426
-
427
-
428
-
429
-
430
-
431
-
432
-
433
-
434
-
435
-
436
-
437
-
438
-
439
-
440
-
441
-
442
-
443
-
444
-
445
-
446
-
447
-
448
-
449
-
450
-
451
-
452
-
453
-
454
-
455
-
456
-
457
-
458
-
459
-
460
-
461
-
462
-
463
-
464
-
465
-
466
-
467
-
468
-
469
-
470
-
471
-
472
 |
 |

HSBC HOLDINGS PLC
Report of the Directors: Impact of Market Turmoil (continued)
Fair values of financial instruments > Carried at fair value
166
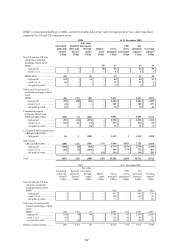
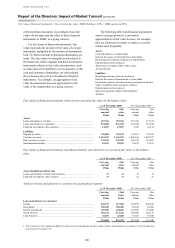
Bases of valuing financial assets and liabilities measured at fair value (continued)
Valuation techniques
Quoted
market
price
Using
observable
inputs
With significant
unobservable
inputs
Total
US$m US$m US$m US$m
At 31 December 2007
Assets
Trading assets .................................................................. 209,339 222,678 13,951 445,968
Financial assets designated at fair value ......................... 28,565 12,694 305 41,564
Derivatives ....................................................................... 8,132 175,493 4,229 187,854
Financial investments: available for sale ........................ 77,045 187,677 8,510 273,232
Liabilities
Trading liabilities ............................................................. 140,629 167,967 5,984 314,580
Financial liabilities designated at fair value .................... 37,709 52,230 – 89,939
Derivatives ....................................................................... 8,879 171,444 3,070 183,393
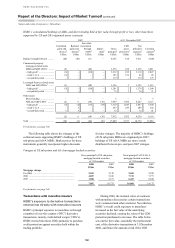
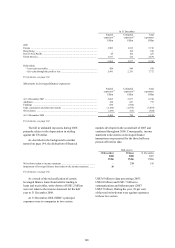
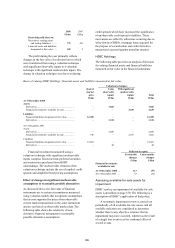
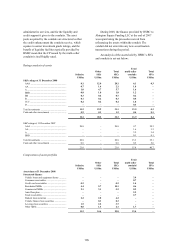
The main drivers of the movement in the
balances of assets and liabilities measured at fair
value with significant unobservable inputs were an
increase in the fair value of derivative assets and
liabilities due to market conditions, and a reduction
in the level of ABSs and loans held at fair value due
either to disposal, repayment or reclassification. At
31 December 2008, financial instruments measured
at fair value using a valuation technique with
significant unobservable inputs represented 2 per
cent of total assets and liabilities measured at fair
value (31 December 2007: 2 per cent).
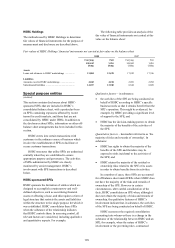
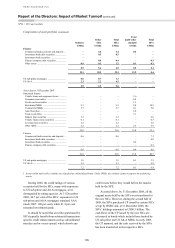
Financial instruments measured at fair value using a valuation technique with significant unobservable inputs
Assets Liabilities
Available
for sale
Held for
trading
Designated
at fair value
through
profit or loss Derivatives
Held for
trading
Designated
at fair value
through
profit or loss
Derivatives
US$m US$m US$m US$m US$m US$m US$m
At 31 December 2008
Private equity investments ........... 2,689 54 225 – – – –
Asset-backed securities ............... 4,264 882 – 95 – – 565
Leveraged finance ....................... – 266 – – – – 33
Loans held for securitisation ....... – 2,133 – – – – –
Structured notes ........................... – 87 – – 5,294 – –
Derivatives with monolines ......... – – – 2,441 – – –
Other derivatives .......................... – – – 7,347 – – 3,207
Other portfolios ............................ 2,163 4,139 235 – 1,215 – –
9,116 7,561 460 9,883 6,509 – 3,805
At 31 December 2007
Private equity investments ........... 3,037 – – – – – –
Asset-backed securities ............... 4,223 2,073 – – – – –
Leveraged finance ....................... – 3,349 – – – – –
Loans held for securitisation ........ – 5,100 – – – – –
Structured notes ........................... – – – – 5,396 – –
Derivatives with monolines ......... – – – 1,010 – – –
Other derivatives .......................... – – – 3,219 – – 3,070
Other portfolios ............................ 1,250 3,429 305 – 588 – –
8,510 13,951 305 4,229 5,984 – 3,070
At 31 December 2008, available-for-sale assets
valued using a valuation technique with significant
unobservable inputs principally comprised various
ABSs, private equity investments and other
portfolios, similar to the position at 31 December
2007.
Trading assets valued using a valuation
technique with significant unobservable inputs
principally comprised loans held for securitisation
and other portfolios. Other portfolios included
holdings in various bonds, preference shares and
corporate and mortgage loans. The decrease during
the year largely reflected leveraged finance and ABS
positions no longer held on a fair value basis
following their reclassification to loans and
receivables as a result of the amendment to IAS 39