HSBC 2008 Annual Report Download - page 38
Download and view the complete annual report
Please find page 38 of the 2008 HSBC annual report below. You can navigate through the pages in the report by either clicking on the pages listed below, or by using the keyword search tool below to find specific information within the annual report.-
 1
1 -
2
-
3
-
4
-
5
-
6
-
7
-
8
-
9
-
10
-
11
-
12
-
13
-
14
-
15
-
16
-
17
-
18
-
19
-
20
-
21
-
22
-
23
-
24
-
25
-
26
-
27
-
 28
28 -
 29
29 -
 30
30 -
 31
31 -
 32
32 -
 33
33 -
 34
34 -
 35
35 -
 36
36 -
 37
37 -
 38
38 -
 39
39 -
 40
40 -
 41
41 -
 42
42 -
 43
43 -
 44
44 -
 45
45 -
 46
46 -
 47
47 -
 48
48 -
49
-
50
-
51
-
52
-
53
-
54
-
55
-
56
-
57
-
58
-
59
-
60
-
61
-
62
-
63
-
64
-
65
-
66
-
67
-
68
-
69
-
70
-
71
-
72
-
73
-
74
-
75
-
76
-
77
-
78
-
79
-
80
-
81
-
82
-
83
-
84
-
85
-
86
-
87
-
88
-
89
-
90
-
91
-
92
-
93
-
94
-
95
-
96
-
97
-
98
-
99
-
100
-
101
-
102
-
103
-
104
-
105
-
106
-
107
-
108
-
109
-
110
-
111
-
112
-
113
-
114
-
115
-
116
-
117
-
118
-
119
-
120
-
121
-
122
-
123
-
124
-
125
-
126
-
127
-
128
-
129
-
130
-
131
-
132
-
133
-
134
-
135
-
136
-
137
-
138
-
139
-
140
-
141
-
142
-
143
-
144
-
145
-
146
-
147
-
148
-
149
-
150
-
151
-
152
-
153
-
154
-
155
-
156
-
157
-
158
-
159
-
160
-
161
-
162
-
163
-
164
-
165
-
166
-
167
-
168
-
169
-
170
-
171
-
172
-
173
-
174
-
175
-
176
-
177
-
178
-
179
-
180
-
181
-
182
-
183
-
184
-
185
-
186
-
187
-
188
-
189
-
190
-
191
-
192
-
193
-
194
-
195
-
196
-
197
-
198
-
199
-
200
-
201
-
202
-
203
-
204
-
205
-
206
-
207
-
208
-
209
-
210
-
211
-
212
-
213
-
214
-
215
-
216
-
217
-
218
-
219
-
220
-
221
-
222
-
223
-
224
-
225
-
226
-
227
-
228
-
229
-
230
-
231
-
232
-
233
-
234
-
235
-
236
-
237
-
238
-
239
-
240
-
241
-
242
-
243
-
244
-
245
-
246
-
247
-
248
-
249
-
250
-
251
-
252
-
253
-
254
-
255
-
256
-
257
-
258
-
259
-
260
-
261
-
262
-
263
-
264
-
265
-
266
-
267
-
268
-
269
-
270
-
271
-
272
-
273
-
274
-
275
-
276
-
277
-
278
-
279
-
280
-
281
-
282
-
283
-
284
-
285
-
286
-
287
-
288
-
289
-
290
-
291
-
292
-
293
-
294
-
295
-
296
-
297
-
298
-
299
-
300
-
301
-
302
-
303
-
304
-
305
-
306
-
307
-
308
-
309
-
310
-
311
-
312
-
313
-
314
-
315
-
316
-
317
-
318
-
319
-
320
-
321
-
322
-
323
-
324
-
325
-
326
-
327
-
328
-
329
-
330
-
331
-
332
-
333
-
334
-
335
-
336
-
337
-
338
-
339
-
340
-
341
-
342
-
343
-
344
-
345
-
346
-
347
-
348
-
349
-
350
-
351
-
352
-
353
-
354
-
355
-
356
-
357
-
358
-
359
-
360
-
361
-
362
-
363
-
364
-
365
-
366
-
367
-
368
-
369
-
370
-
371
-
372
-
373
-
374
-
375
-
376
-
377
-
378
-
379
-
380
-
381
-
382
-
383
-
384
-
385
-
386
-
387
-
388
-
389
-
390
-
391
-
392
-
393
-
394
-
395
-
396
-
397
-
398
-
399
-
400
-
401
-
402
-
403
-
404
-
405
-
406
-
407
-
408
-
409
-
410
-
411
-
412
-
413
-
414
-
415
-
416
-
417
-
418
-
419
-
420
-
421
-
422
-
423
-
424
-
425
-
426
-
427
-
428
-
429
-
430
-
431
-
432
-
433
-
434
-
435
-
436
-
437
-
438
-
439
-
440
-
441
-
442
-
443
-
444
-
445
-
446
-
447
-
448
-
449
-
450
-
451
-
452
-
453
-
454
-
455
-
456
-
457
-
458
-
459
-
460
-
461
-
462
-
463
-
464
-
465
-
466
-
467
-
468
-
469
-
470
-
471
-
472
 |
 |

HSBC HOLDINGS PLC
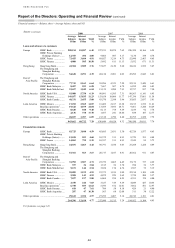
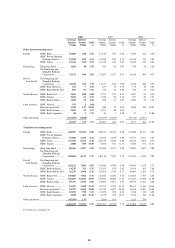
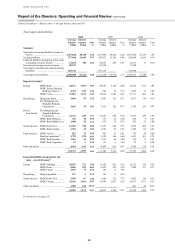
Report of the Directors: Operating and Financial Review (continued)
Financial summary > Group performance > Operating expenses
36
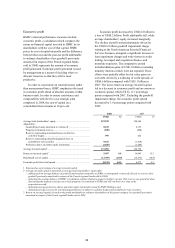
years. In the rest of the UK business, loan
impairment charges in the second half of 2007 were
lower than in the first half of the year, as overall
credit quality improved following measures taken to
tighten underwriting standards and improve the
credit quality of new business. Although losses from
mortgage lending remained low, maximum loan to
value ratios were reduced during the year to mitigate
the effects of a possible housing market downturn.
In Mexico, higher loan impairment charges
were driven by strong growth in loan balances, a
deterioration in credit quality and portfolio
seasoning.
For the Group as a whole, the aggregate
outstanding customer loan impairment allowances
at 31 December 2007 of US$19.2 billion represented
2.0 per cent of gross customer advances (net of
reverse repos and settlement accounts), compared
with 1.6 per cent at the end of 2006.
Impaired loans to customers were
US$18.3 billion at 31 December 2007 compared
with US$13.8 billion at 31 December 2006. On a
constant currency basis, impaired loans to customers
were 28 per cent higher than in 2006 compared with
customer lending growth (excluding loans to the
financial sector and settlement accounts) of
7 per cent.
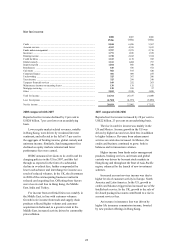
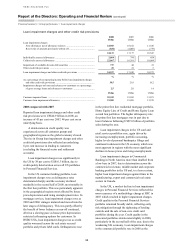
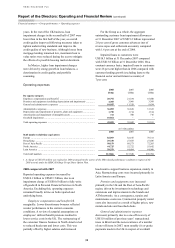
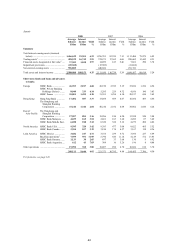
Operating expenses
2008 2007 2006
US$m US$m US$m
By expense category
Employee compensation and benefits1 ............................................................ 20,792 21,334 18,500
Premises and equipment (excluding depreciation and impairment) ............... 4,305 3,966 3,389
General and administrative expenses .............................................................. 10,955 11,328 9,434
Administrative expenses .................................................................................. 36,052 36,628 31,323
Depreciation and impairment of property, plant and equipment .................... 1,750 1,714 1,514
Amortisation and impairment of intangible assets .......................................... 733 700 716
Goodwill impairment ....................................................................................... 10,564 – –
Total operating expenses ................................................................................. 49,099 39,042 33,553
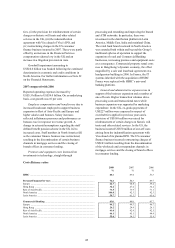
At 31 December
2008 2007 2006
Staff numbers (full-time equivalent)
Europe .............................................................................................................. 82,093 82,166 78,311
Hong Kong ...................................................................................................... 29,330 27,655 27,586
Rest of Asia-Pacific ......................................................................................... 98,159 88,573 72,265
North America ................................................................................................. 44,725 52,722 55,642
Latin America .................................................................................................. 58,559 64,404 64,900
Total staff numbers .......................................................................................... 312,866 315,520 298,704
1 A charge of US$135 million was realised in 2006 arising from the waiver of the TSR-related performance condition in respect of the
2003 awards under the HSBC Holdings Group Share Option Plan.
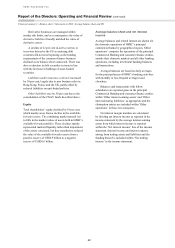
2008 compared with 2007
Reported operating expenses increased by
US$10.1 billion to US$49.1 billion, due to an
impairment charge of US$10.6 billion to fully write
off goodwill in Personal Financial Services in North
America. Excluding this, operating expenses
remained broadly in line on both reported and
underlying bases.
Employee compensation and benefits fell
marginally. Lower discretionary bonuses reflected
weaker performance in the current economic
conditions. A review of actuarial assumptions on
employees’ defined benefit pensions resulted in
lower service costs in the UK. The restructuring of
the consumer finance business in North America led
to reduced headcount and lower costs. This was
partially offset by higher salaries and increased
headcount to support business expansion, mainly in
Asia. Restructuring costs were incurred primarily in
Latin America and Europe.
Premises and equipment costs increased
primarily in the UK and the Rest of Asia-Pacific
region, driven by investment in technology and
extensions and improvements to the branch and
ATM networks. As a consequence, repairs and
maintenance costs rose. Commercial property rental
costs also increased as a result of higher prices, new
rentals and sale and leaseback deals.
General and administrative expenses
decreased, primarily due to a one-off recovery of
US$110 million of previous years’ transactional
taxes in Brazil and the non-recurrence of a number
of one-off items in 2007, most notably (i) ex-gratia
payments made in the UK in respect of overdraft