HSBC 2008 Annual Report Download - page 365
Download and view the complete annual report
Please find page 365 of the 2008 HSBC annual report below. You can navigate through the pages in the report by either clicking on the pages listed below, or by using the keyword search tool below to find specific information within the annual report.-
 1
1 -
2
-
3
-
4
-
5
-
6
-
7
-
8
-
9
-
10
-
11
-
12
-
13
-
14
-
15
-
16
-
17
-
18
-
19
-
20
-
21
-
22
-
23
-
24
-
25
-
26
-
27
-
28
-
29
-
30
-
31
-
32
-
33
-
34
-
35
-
36
-
37
-
38
-
39
-
40
-
41
-
42
-
43
-
44
-
45
-
46
-
47
-
48
-
49
-
50
-
51
-
52
-
53
-
54
-
55
-
56
-
57
-
58
-
59
-
60
-
61
-
62
-
63
-
64
-
65
-
66
-
67
-
68
-
69
-
70
-
71
-
72
-
73
-
74
-
75
-
76
-
77
-
78
-
79
-
80
-
81
-
82
-
83
-
84
-
85
-
86
-
87
-
88
-
89
-
90
-
91
-
92
-
93
-
94
-
95
-
96
-
97
-
98
-
99
-
100
-
101
-
102
-
103
-
104
-
105
-
106
-
107
-
108
-
109
-
110
-
111
-
112
-
113
-
114
-
115
-
116
-
117
-
118
-
119
-
120
-
121
-
122
-
123
-
124
-
125
-
126
-
127
-
128
-
129
-
130
-
131
-
132
-
133
-
134
-
135
-
136
-
137
-
138
-
139
-
140
-
141
-
142
-
143
-
144
-
145
-
146
-
147
-
148
-
149
-
150
-
151
-
152
-
153
-
154
-
155
-
156
-
157
-
158
-
159
-
160
-
161
-
162
-
163
-
164
-
165
-
166
-
167
-
168
-
169
-
170
-
171
-
172
-
173
-
174
-
175
-
176
-
177
-
178
-
179
-
180
-
181
-
182
-
183
-
184
-
185
-
186
-
187
-
188
-
189
-
190
-
191
-
192
-
193
-
194
-
195
-
196
-
197
-
198
-
199
-
200
-
201
-
202
-
203
-
204
-
205
-
206
-
207
-
208
-
209
-
210
-
211
-
212
-
213
-
214
-
215
-
216
-
217
-
218
-
219
-
220
-
221
-
222
-
223
-
224
-
225
-
226
-
227
-
228
-
229
-
230
-
231
-
232
-
233
-
234
-
235
-
236
-
237
-
238
-
239
-
240
-
241
-
242
-
243
-
244
-
245
-
246
-
247
-
248
-
249
-
250
-
251
-
252
-
253
-
254
-
255
-
256
-
257
-
258
-
259
-
260
-
261
-
262
-
263
-
264
-
265
-
266
-
267
-
268
-
269
-
270
-
271
-
272
-
273
-
274
-
275
-
276
-
277
-
278
-
279
-
280
-
281
-
282
-
283
-
284
-
285
-
286
-
287
-
288
-
289
-
290
-
291
-
292
-
293
-
294
-
295
-
296
-
297
-
298
-
299
-
300
-
301
-
302
-
303
-
304
-
305
-
306
-
307
-
308
-
309
-
310
-
311
-
312
-
313
-
314
-
315
-
316
-
317
-
318
-
319
-
320
-
321
-
322
-
323
-
324
-
325
-
326
-
327
-
328
-
329
-
330
-
331
-
332
-
333
-
334
-
335
-
336
-
337
-
338
-
339
-
340
-
341
-
342
-
343
-
344
-
345
-
346
-
347
-
348
-
349
-
350
-
351
-
352
-
353
-
354
-
 355
355 -
 356
356 -
 357
357 -
 358
358 -
 359
359 -
 360
360 -
 361
361 -
 362
362 -
 363
363 -
 364
364 -
 365
365 -
 366
366 -
 367
367 -
 368
368 -
 369
369 -
 370
370 -
 371
371 -
 372
372 -
 373
373 -
 374
374 -
 375
375 -
376
-
377
-
378
-
379
-
380
-
381
-
382
-
383
-
384
-
385
-
386
-
387
-
388
-
389
-
390
-
391
-
392
-
393
-
394
-
395
-
396
-
397
-
398
-
399
-
400
-
401
-
402
-
403
-
404
-
405
-
406
-
407
-
408
-
409
-
410
-
411
-
412
-
413
-
414
-
415
-
416
-
417
-
418
-
419
-
420
-
421
-
422
-
423
-
424
-
425
-
426
-
427
-
428
-
429
-
430
-
431
-
432
-
433
-
434
-
435
-
436
-
437
-
438
-
439
-
440
-
441
-
442
-
443
-
444
-
445
-
446
-
447
-
448
-
449
-
450
-
451
-
452
-
453
-
454
-
455
-
456
-
457
-
458
-
459
-
460
-
461
-
462
-
463
-
464
-
465
-
466
-
467
-
468
-
469
-
470
-
471
-
472
 |
 |

363
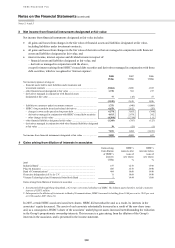
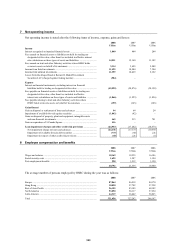
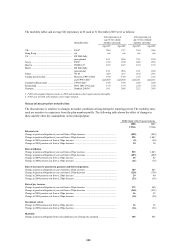
7 Net operating income
Net operating income is stated after the following items of income, expense, gains and losses:
2008 2007 2006
US$m US$m US$m
Income
Interest recognised on impaired financial assets ............................................. 1,040 404 284
Fees earned on financial assets or liabilities not held for trading nor
designated at fair value, other than fees included in effective interest
rate calculations on these types of assets and liabilities ............................. 14,511 15,140 11,182
Fees earned on trust and other fiduciary activities where HSBC holds
or invests assets on behalf of its customers ................................................. 3,314 3,695 2,909
Income from listed investments ....................................................................... 11,425 10,944 7,304
Income from unlisted investments ................................................................... 11,359 10,429 9,192
Losses from the alleged fraud at Bernard L Madoff Investment
Securities LLC (charged against trading income) ....................................... (984) – –
Expense
Interest on financial instruments, excluding interest on financial
liabilities held for trading or designated at fair value ................................. (45,525) (50,876) (38,158)
Fees payable on financial assets or liabilities not held for trading nor
designated at fair value, other than fees included in effective
interest rate calculations on these types of assets and liabilities ................ (1,866) (1,923) (1,826)
Fees payable relating to trust and other fiduciary activities where
HSBC holds or invests assets on behalf of its customers ........................... (159) (163) (103)
Gains/(losses)
Gain on disposal or settlement of loans and advances .................................... 94 64 24
Impairment of available-for-sale equity securities .......................................... (1,042) (42) –
Gains on disposal of property, plant and equipment, intangible assets
and non-financial investments ..................................................................... 465 213 781
Gain on repurchase of 8 Canada Square ......................................................... 416 – –
Loan impairment charges and other credit risk provisions ...................... (24,937) (17,242) (10,573)
Net impairment charge on loans and advances ........................................... (24,131) (17,177) (10,547)
Impairment of available-for-sale debt securities ......................................... (737) (44) (21)
Impairment in respect of other credit risk provisions ................................. (69) (21) (5)
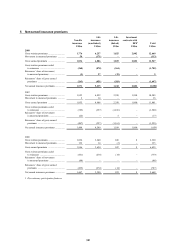
8 Employee compensation and benefits
2008 2007 2006
US$m US$m US$m
Wages and salaries ........................................................................................... 18,169 18,535 16,186
Social security costs ......................................................................................... 1,625 1,587 1,194
Post-employment benefits ............................................................................... 998 1,212 1,120
20,792 21,334 18,500
The average number of persons employed by HSBC during the year was as follows:
2008 2007 2006
Europe .............................................................................................................. 87,864 86,918 84,170
Hong Kong ....................................................................................................... 30,030 27,702 27,328
Rest of Asia-Pacific ......................................................................................... 96,155 83,103 68,182
North America ................................................................................................. 53,090 58,117 57,654
Latin America .................................................................................................. 64,319 66,442 58,863
Total ................................................................................................................. 331,458 322,282 296,197