HSBC 2008 Annual Report Download - page 43
Download and view the complete annual report
Please find page 43 of the 2008 HSBC annual report below. You can navigate through the pages in the report by either clicking on the pages listed below, or by using the keyword search tool below to find specific information within the annual report.-
 1
1 -
 2
2 -
 3
3 -
 4
4 -
 5
5 -
 6
6 -
 7
7 -
 8
8 -
 9
9 -
 10
10 -
 11
11 -
 12
12 -
 13
13 -
 14
14 -
 15
15 -
 16
16 -
 17
17 -
 18
18 -
 19
19 -
 20
20 -
 21
21 -
 22
22 -
 23
23 -
 24
24 -
 25
25 -
 26
26 -
 27
27 -
 28
28 -
 29
29 -
 30
30 -
 31
31 -
 32
32 -
 33
33 -
 34
34 -
 35
35 -
 36
36 -
 37
37 -
 38
38 -
 39
39 -
 40
40 -
 41
41 -
 42
42 -
 43
43 -
 44
44 -
 45
45 -
 46
46 -
 47
47 -
 48
48 -
 49
49 -
 50
50 -
 51
51 -
 52
52 -
 53
53 -
 54
54 -
 55
55 -
 56
56 -
 57
57 -
 58
58 -
 59
59 -
 60
60 -
 61
61 -
 62
62 -
 63
63 -
 64
64 -
 65
65 -
 66
66 -
 67
67 -
 68
68 -
 69
69 -
 70
70 -
 71
71 -
 72
72 -
 73
73 -
 74
74 -
 75
75 -
 76
76 -
 77
77 -
 78
78 -
 79
79 -
 80
80 -
 81
81 -
 82
82 -
 83
83 -
 84
84 -
 85
85 -
 86
86 -
 87
87 -
 88
88 -
 89
89 -
 90
90 -
 91
91 -
 92
92 -
 93
93 -
 94
94 -
 95
95 -
 96
96 -
 97
97 -
 98
98 -
 99
99 -
 100
100 -
 101
101 -
 102
102 -
 103
103 -
 104
104 -
 105
105 -
 106
106 -
 107
107 -
 108
108 -
 109
109 -
 110
110 -
 111
111 -
 112
112 -
 113
113 -
 114
114 -
 115
115 -
 116
116 -
 117
117 -
 118
118 -
 119
119 -
 120
120 -
 121
121 -
 122
122 -
 123
123 -
 124
124 -
 125
125 -
 126
126 -
 127
127 -
 128
128 -
 129
129 -
 130
130 -
 131
131 -
 132
132 -
 133
133 -
 134
134 -
 135
135 -
 136
136 -
 137
137 -
 138
138 -
 139
139 -
 140
140 -
 141
141 -
 142
142 -
 143
143 -
 144
144 -
 145
145 -
 146
146 -
 147
147 -
 148
148 -
 149
149 -
 150
150 -
 151
151 -
 152
152 -
 153
153 -
 154
154 -
 155
155 -
 156
156 -
 157
157 -
 158
158 -
 159
159 -
 160
160 -
 161
161 -
 162
162 -
 163
163 -
 164
164 -
 165
165 -
 166
166 -
 167
167 -
 168
168 -
 169
169 -
 170
170 -
 171
171 -
 172
172 -
 173
173 -
 174
174 -
 175
175 -
 176
176 -
 177
177 -
 178
178 -
 179
179 -
 180
180 -
 181
181 -
 182
182 -
 183
183 -
 184
184 -
 185
185 -
 186
186 -
 187
187 -
 188
188 -
 189
189 -
 190
190 -
 191
191 -
 192
192 -
 193
193 -
 194
194 -
 195
195 -
 196
196 -
 197
197 -
 198
198 -
 199
199 -
 200
200 -
 201
201 -
 202
202 -
 203
203 -
 204
204 -
 205
205 -
 206
206 -
 207
207 -
 208
208 -
 209
209 -
 210
210 -
 211
211 -
 212
212 -
 213
213 -
 214
214 -
 215
215 -
 216
216 -
 217
217 -
 218
218 -
 219
219 -
 220
220 -
 221
221 -
 222
222 -
 223
223 -
 224
224 -
 225
225 -
 226
226 -
 227
227 -
 228
228 -
 229
229 -
 230
230 -
 231
231 -
 232
232 -
 233
233 -
 234
234 -
 235
235 -
 236
236 -
 237
237 -
 238
238 -
 239
239 -
 240
240 -
 241
241 -
 242
242 -
 243
243 -
 244
244 -
 245
245 -
 246
246 -
 247
247 -
 248
248 -
 249
249 -
 250
250 -
 251
251 -
 252
252 -
 253
253 -
 254
254 -
 255
255 -
 256
256 -
 257
257 -
 258
258 -
 259
259 -
 260
260 -
 261
261 -
 262
262 -
 263
263 -
 264
264 -
 265
265 -
 266
266 -
 267
267 -
 268
268 -
 269
269 -
 270
270 -
 271
271 -
 272
272 -
 273
273 -
 274
274 -
 275
275 -
 276
276 -
 277
277 -
 278
278 -
 279
279 -
 280
280 -
 281
281 -
 282
282 -
 283
283 -
 284
284 -
 285
285 -
 286
286 -
 287
287 -
 288
288 -
 289
289 -
 290
290 -
 291
291 -
 292
292 -
 293
293 -
 294
294 -
 295
295 -
 296
296 -
 297
297 -
 298
298 -
 299
299 -
 300
300 -
 301
301 -
 302
302 -
 303
303 -
 304
304 -
 305
305 -
 306
306 -
 307
307 -
 308
308 -
 309
309 -
 310
310 -
 311
311 -
 312
312 -
 313
313 -
 314
314 -
 315
315 -
 316
316 -
 317
317 -
 318
318 -
 319
319 -
 320
320 -
 321
321 -
 322
322 -
 323
323 -
 324
324 -
 325
325 -
 326
326 -
 327
327 -
 328
328 -
 329
329 -
 330
330 -
 331
331 -
 332
332 -
 333
333 -
 334
334 -
 335
335 -
 336
336 -
 337
337 -
 338
338 -
 339
339 -
 340
340 -
 341
341 -
 342
342 -
 343
343 -
 344
344 -
 345
345 -
 346
346 -
 347
347 -
 348
348 -
 349
349 -
 350
350 -
 351
351 -
 352
352 -
 353
353 -
 354
354 -
 355
355 -
 356
356 -
 357
357 -
 358
358 -
 359
359 -
 360
360 -
 361
361 -
 362
362 -
 363
363 -
 364
364 -
 365
365 -
 366
366 -
 367
367 -
 368
368 -
 369
369 -
 370
370 -
 371
371 -
 372
372 -
 373
373 -
 374
374 -
 375
375 -
 376
376 -
 377
377 -
 378
378 -
 379
379 -
 380
380 -
 381
381 -
 382
382 -
 383
383 -
 384
384 -
 385
385 -
 386
386 -
 387
387 -
 388
388 -
 389
389 -
 390
390 -
 391
391 -
 392
392 -
 393
393 -
 394
394 -
 395
395 -
 396
396 -
 397
397 -
 398
398 -
 399
399 -
 400
400 -
 401
401 -
 402
402 -
 403
403 -
 404
404 -
 405
405 -
 406
406 -
 407
407 -
 408
408 -
 409
409 -
 410
410 -
 411
411 -
 412
412 -
 413
413 -
 414
414 -
 415
415 -
 416
416 -
 417
417 -
 418
418 -
 419
419 -
 420
420 -
 421
421 -
 422
422 -
 423
423 -
 424
424 -
 425
425 -
 426
426 -
 427
427 -
 428
428 -
 429
429 -
 430
430 -
 431
431 -
 432
432 -
 433
433 -
 434
434 -
 435
435 -
 436
436 -
 437
437 -
 438
438 -
 439
439 -
 440
440 -
 441
441 -
 442
442 -
 443
443 -
 444
444 -
 445
445 -
 446
446 -
 447
447 -
 448
448 -
 449
449 -
 450
450 -
 451
451 -
 452
452 -
 453
453 -
 454
454 -
 455
455 -
 456
456 -
 457
457 -
 458
458 -
 459
459 -
 460
460 -
 461
461 -
 462
462 -
 463
463 -
 464
464 -
 465
465 -
 466
466 -
 467
467 -
 468
468 -
 469
469 -
 470
470 -
 471
471 -
 472
472
 |
 |
41
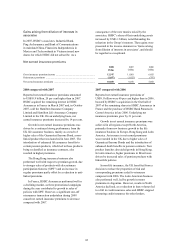
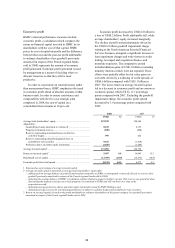
partly to ‘Loans and Advances’ and partly to
‘Financial investments’ following the changes to
International Accounting Standard 39 – ‘Financial
Instruments – Recognition and Measurement’
(‘IAS39’) issued in October 2008 by the IASB.
Excluding these effects, trading assets remained
broadly unchanged as rises in Europe and Asia,
where the Group increased its holdings of
government bonds, were offset by the run-off of the
mortgage-backed securities portfolio in the US and a
reduction in debt securities held for balance sheet
management purposes due to changes in liquidity
and risk preference.
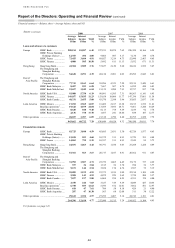
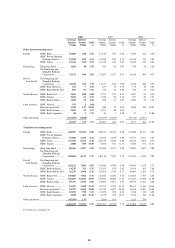
An 18 per cent decline in financial assets
designated at fair value was driven by falling equity
markets, which reduced the value of assets held to
meet life insurance liabilities, particularly in Hong
Kong and France. To the extent that these liabilities
related to unit-linked and participating insurance
contracts, there was a corresponding decline in
liabilities under insurance contracts. The
underperformance of certain investment products
also led clients to withdraw funds.
Derivative assets rose significantly, led by an
increase in interest rate derivatives with further
growth in credit and foreign exchange derivatives.
The global falls in interest rates resulted in
significant gaps between the fixed and floating legs
of interest rate swaps, leading to substantial mark-to-
market increases in the value of interest rate swap
positions. Widening credit spreads and increasing
market volatility caused mark-to-market increases in
the value of credit derivatives held in the UK and the
US. Foreign exchange derivative asset growth was
driven by a combination of increased volumes and
mark-to-market rises in existing positions in the UK.
Under IFRS, only limited netting is allowed between
derivative assets and liabilities with the same
counterparty, and the balance sheet value is therefore
significantly higher than the credit exposure. For
information on maximum exposure to credit risk, see
pages 197 to 200.
A 29 per cent decline in loans and advances
to banks occurred mainly in Hong Kong and the UK
where Balance Sheet Management invested a greater
proportion of its assets in government and
government-guaranteed debt.
HSBC also reduced counterparty credit risk in
the UK by channelling an increasing proportion of
lending to banks through the London Clearing House
in the form of reverse repos. This is recorded within
customer loans even when the end counterparty is a
bank, which means the fall in loans and advances to
banks and the rise in loans and advances to
customers are magnified. The rise in loans and
advances to customers was also inflated by the
reclassification of US$15 billion of assets following
changes to IAS39 isused in October 2008.
Further increases in loans and advances to
customers were due to growth in mortgage lending
in Europe and Asia, as well as to a rise in overdraft
balances to customers whose exposures are managed
net but reported gross under IFRS. These rises were
offset by a reduction in customer lending in the US
due to the run-off of the mortgage services portfolio,
the sale of certain loan portfolios at HSBC USA,
tighter underwriting criteria which restricted
originations in the consumer lending and credit card
portfolios, and the cessation of most new
originations in the US vehicle finance portfolio.
Financial investments grew by 15 per cent as
Balance Sheet Management assets were increasingly
classified as available-for-sale financial investments
rather than trading assets. As noted above, there was
also a rise in financial investments in the UK as the
Group placed a greater proportion of surplus funds in
government issued or guaranteed debt. The growth
in the Group’s financial investments was partly
offset by a reduction in holdings of asset-backed
securities, including those held through special
purpose entities, which decreased due to a
combination of asset sales, amortisation and write-
downs. For details of the Group’s asset-backed
securities portfolios, see pages 145 to 158.
Liabilities
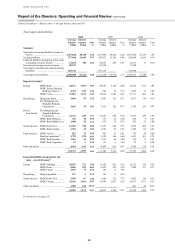
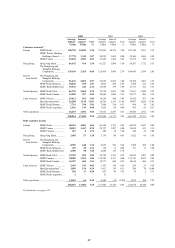
Deposits by banks rose by 14 per cent, driven, in
particular, by increases in France, due to a rise in
repo activity to finance increased trading activity,
and in Hong Kong, where banks responded to
HSBC’s reputation for strength and security and
deposited their surplus liquidity with the Group.
Customer account balances grew by 16 per cent,
driven by strong inflows from customers attracted by
HSBC’s relative financial strength as they withdrew
funds from more volatile investments.
Trading liabilities declined 9 per cent as a fall in
third-party funding requirements allowed a reduction
in liabilities in Hong Kong, and repo transactions
were reduced in Europe to manage liquidity and
counterparty credit risk.
A significant widening of credit spreads led to
further falls in the fair value of the Group’s own debt
which reduced financial liabilities designated at fair
value. This was compounded by a decline in
liabilities in the UK due to the underperformance of
certain investment products.
