HSBC 2008 Annual Report Download - page 187
Download and view the complete annual report
Please find page 187 of the 2008 HSBC annual report below. You can navigate through the pages in the report by either clicking on the pages listed below, or by using the keyword search tool below to find specific information within the annual report.-
 1
1 -
2
-
3
-
4
-
5
-
6
-
7
-
8
-
9
-
10
-
11
-
12
-
13
-
14
-
15
-
16
-
17
-
18
-
19
-
20
-
21
-
22
-
23
-
24
-
25
-
26
-
27
-
28
-
29
-
30
-
31
-
32
-
33
-
34
-
35
-
36
-
37
-
38
-
39
-
40
-
41
-
42
-
43
-
44
-
45
-
46
-
47
-
48
-
49
-
50
-
51
-
52
-
53
-
54
-
55
-
56
-
57
-
58
-
59
-
60
-
61
-
62
-
63
-
64
-
65
-
66
-
67
-
68
-
69
-
70
-
71
-
72
-
73
-
74
-
75
-
76
-
77
-
78
-
79
-
80
-
81
-
82
-
83
-
84
-
85
-
86
-
87
-
88
-
89
-
90
-
91
-
92
-
93
-
94
-
95
-
96
-
97
-
98
-
99
-
100
-
101
-
102
-
103
-
104
-
105
-
106
-
107
-
108
-
109
-
110
-
111
-
112
-
113
-
114
-
115
-
116
-
117
-
118
-
119
-
120
-
121
-
122
-
123
-
124
-
125
-
126
-
127
-
128
-
129
-
130
-
131
-
132
-
133
-
134
-
135
-
136
-
137
-
138
-
139
-
140
-
141
-
142
-
143
-
144
-
145
-
146
-
147
-
148
-
149
-
150
-
151
-
152
-
153
-
154
-
155
-
156
-
157
-
158
-
159
-
160
-
161
-
162
-
163
-
164
-
165
-
166
-
167
-
168
-
169
-
170
-
171
-
172
-
173
-
174
-
175
-
176
-
 177
177 -
 178
178 -
 179
179 -
 180
180 -
 181
181 -
 182
182 -
 183
183 -
 184
184 -
 185
185 -
 186
186 -
 187
187 -
 188
188 -
 189
189 -
 190
190 -
 191
191 -
 192
192 -
 193
193 -
 194
194 -
 195
195 -
 196
196 -
 197
197 -
198
-
199
-
200
-
201
-
202
-
203
-
204
-
205
-
206
-
207
-
208
-
209
-
210
-
211
-
212
-
213
-
214
-
215
-
216
-
217
-
218
-
219
-
220
-
221
-
222
-
223
-
224
-
225
-
226
-
227
-
228
-
229
-
230
-
231
-
232
-
233
-
234
-
235
-
236
-
237
-
238
-
239
-
240
-
241
-
242
-
243
-
244
-
245
-
246
-
247
-
248
-
249
-
250
-
251
-
252
-
253
-
254
-
255
-
256
-
257
-
258
-
259
-
260
-
261
-
262
-
263
-
264
-
265
-
266
-
267
-
268
-
269
-
270
-
271
-
272
-
273
-
274
-
275
-
276
-
277
-
278
-
279
-
280
-
281
-
282
-
283
-
284
-
285
-
286
-
287
-
288
-
289
-
290
-
291
-
292
-
293
-
294
-
295
-
296
-
297
-
298
-
299
-
300
-
301
-
302
-
303
-
304
-
305
-
306
-
307
-
308
-
309
-
310
-
311
-
312
-
313
-
314
-
315
-
316
-
317
-
318
-
319
-
320
-
321
-
322
-
323
-
324
-
325
-
326
-
327
-
328
-
329
-
330
-
331
-
332
-
333
-
334
-
335
-
336
-
337
-
338
-
339
-
340
-
341
-
342
-
343
-
344
-
345
-
346
-
347
-
348
-
349
-
350
-
351
-
352
-
353
-
354
-
355
-
356
-
357
-
358
-
359
-
360
-
361
-
362
-
363
-
364
-
365
-
366
-
367
-
368
-
369
-
370
-
371
-
372
-
373
-
374
-
375
-
376
-
377
-
378
-
379
-
380
-
381
-
382
-
383
-
384
-
385
-
386
-
387
-
388
-
389
-
390
-
391
-
392
-
393
-
394
-
395
-
396
-
397
-
398
-
399
-
400
-
401
-
402
-
403
-
404
-
405
-
406
-
407
-
408
-
409
-
410
-
411
-
412
-
413
-
414
-
415
-
416
-
417
-
418
-
419
-
420
-
421
-
422
-
423
-
424
-
425
-
426
-
427
-
428
-
429
-
430
-
431
-
432
-
433
-
434
-
435
-
436
-
437
-
438
-
439
-
440
-
441
-
442
-
443
-
444
-
445
-
446
-
447
-
448
-
449
-
450
-
451
-
452
-
453
-
454
-
455
-
456
-
457
-
458
-
459
-
460
-
461
-
462
-
463
-
464
-
465
-
466
-
467
-
468
-
469
-
470
-
471
-
472
 |
 |

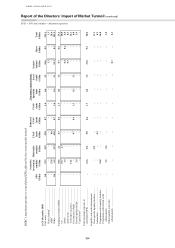
185
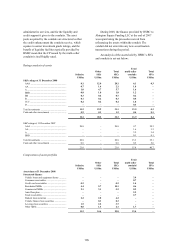
Securities Non-money market funds
SIVs
investment
conduits1
Multi-seller
conduits
Enhanced
VNAV funds
Specialist
funds
Local
funds2,6
Securit-
isations3 Other Total
US$bn US$bn US$bn US$bn US$bn US$bn US$bn US$bn US$bn
At 31 December 2007
Total assets ............................................................................................. 40.7 21.6 15.8 5.7 1.0 3.1 74.7 0.1 162.7
Direct lending4 .................................................................................... – – – – – – 3.6 – 3.6
ABSs4 ................................................................................................. 32.1 21.0 – – – – – – 53.1
Other ................................................................................................... 8.6 0.6 15.8 5.7 1.0 3.1 71.1 0.1 106.0
Funding provided by HSBC ................................................................... 15.9 7.8 8.6 4.6 0.4 2.8 1.0 – 41.1
CP ....................................................................................................... 2.4 7.8 8.6 – – – – – 18.8
MTNs .................................................................................................. 5.3 – – – – – 0.3 – 5.6
Junior notes ........................................................................................ – – – – – – 0.7 – 0.7
Term repos executed .......................................................................... 8.2 – – – – – – – 8.2
Investments in funds .......................................................................... – – – 4.6 0.4 2.8 – – 7.8
Total maximum exposure to consolidated SPEs .................................... 40.0 25.7 21.2 4.6 0.4 2.8 30.6 0.1 125.4
Liquidity and credit enhancements
Deal-specific liquidity facilities ......................................................... – – 21.2 – – – – – 21.2
Programme-wide liquidity facilities .................................................. 0.8 25.7 – – – – – – 26.5
Programme-wide limited credit enhancements ................................. – 0.2 0.7 – – – – – 0.9
Other liquidity and credit enhancements ........................................... – – – – – – 0.2 – 0.2
1 The securities investment conduits include Mazarin, Barion, Malachite and Solitaire.
2 Local investment management funds.
3 Also includes consolidated SPEs that hold mortgage loans held at fair value.
4 These assets only include those measured at fair value. For details on the geographical origin of the mortgage loans held at fair value and ABSs, including those represented by MBSs and CDOs held in
consolidated SIVs and securities investment conduits, see ‘Nature and extent of HSBC’s exposures’ on page 150. The geographical origin of the loans and receivables held by the multi-seller conduits is
disclosed on page 177.
5 The carrying amount of HSBC’s holding of capital notes in the securities investment conduits amounted to US$1.9 million (2007: n/a) with a par value of US$52 million (2007: n/a).
6 Total assets for 2007 have been restated as a result of reclassifying assets amounting to US$17 billion from VNAV to local funds.