HSBC 2008 Annual Report Download - page 174
Download and view the complete annual report
Please find page 174 of the 2008 HSBC annual report below. You can navigate through the pages in the report by either clicking on the pages listed below, or by using the keyword search tool below to find specific information within the annual report.-
 1
1 -
2
-
3
-
4
-
5
-
6
-
7
-
8
-
9
-
10
-
11
-
12
-
13
-
14
-
15
-
16
-
17
-
18
-
19
-
20
-
21
-
22
-
23
-
24
-
25
-
26
-
27
-
28
-
29
-
30
-
31
-
32
-
33
-
34
-
35
-
36
-
37
-
38
-
39
-
40
-
41
-
42
-
43
-
44
-
45
-
46
-
47
-
48
-
49
-
50
-
51
-
52
-
53
-
54
-
55
-
56
-
57
-
58
-
59
-
60
-
61
-
62
-
63
-
64
-
65
-
66
-
67
-
68
-
69
-
70
-
71
-
72
-
73
-
74
-
75
-
76
-
77
-
78
-
79
-
80
-
81
-
82
-
83
-
84
-
85
-
86
-
87
-
88
-
89
-
90
-
91
-
92
-
93
-
94
-
95
-
96
-
97
-
98
-
99
-
100
-
101
-
102
-
103
-
104
-
105
-
106
-
107
-
108
-
109
-
110
-
111
-
112
-
113
-
114
-
115
-
116
-
117
-
118
-
119
-
120
-
121
-
122
-
123
-
124
-
125
-
126
-
127
-
128
-
129
-
130
-
131
-
132
-
133
-
134
-
135
-
136
-
137
-
138
-
139
-
140
-
141
-
142
-
143
-
144
-
145
-
146
-
147
-
148
-
149
-
150
-
151
-
152
-
153
-
154
-
155
-
156
-
157
-
158
-
159
-
160
-
161
-
162
-
163
-
 164
164 -
 165
165 -
 166
166 -
 167
167 -
 168
168 -
 169
169 -
 170
170 -
 171
171 -
 172
172 -
 173
173 -
 174
174 -
 175
175 -
 176
176 -
 177
177 -
 178
178 -
 179
179 -
 180
180 -
 181
181 -
 182
182 -
 183
183 -
 184
184 -
185
-
186
-
187
-
188
-
189
-
190
-
191
-
192
-
193
-
194
-
195
-
196
-
197
-
198
-
199
-
200
-
201
-
202
-
203
-
204
-
205
-
206
-
207
-
208
-
209
-
210
-
211
-
212
-
213
-
214
-
215
-
216
-
217
-
218
-
219
-
220
-
221
-
222
-
223
-
224
-
225
-
226
-
227
-
228
-
229
-
230
-
231
-
232
-
233
-
234
-
235
-
236
-
237
-
238
-
239
-
240
-
241
-
242
-
243
-
244
-
245
-
246
-
247
-
248
-
249
-
250
-
251
-
252
-
253
-
254
-
255
-
256
-
257
-
258
-
259
-
260
-
261
-
262
-
263
-
264
-
265
-
266
-
267
-
268
-
269
-
270
-
271
-
272
-
273
-
274
-
275
-
276
-
277
-
278
-
279
-
280
-
281
-
282
-
283
-
284
-
285
-
286
-
287
-
288
-
289
-
290
-
291
-
292
-
293
-
294
-
295
-
296
-
297
-
298
-
299
-
300
-
301
-
302
-
303
-
304
-
305
-
306
-
307
-
308
-
309
-
310
-
311
-
312
-
313
-
314
-
315
-
316
-
317
-
318
-
319
-
320
-
321
-
322
-
323
-
324
-
325
-
326
-
327
-
328
-
329
-
330
-
331
-
332
-
333
-
334
-
335
-
336
-
337
-
338
-
339
-
340
-
341
-
342
-
343
-
344
-
345
-
346
-
347
-
348
-
349
-
350
-
351
-
352
-
353
-
354
-
355
-
356
-
357
-
358
-
359
-
360
-
361
-
362
-
363
-
364
-
365
-
366
-
367
-
368
-
369
-
370
-
371
-
372
-
373
-
374
-
375
-
376
-
377
-
378
-
379
-
380
-
381
-
382
-
383
-
384
-
385
-
386
-
387
-
388
-
389
-
390
-
391
-
392
-
393
-
394
-
395
-
396
-
397
-
398
-
399
-
400
-
401
-
402
-
403
-
404
-
405
-
406
-
407
-
408
-
409
-
410
-
411
-
412
-
413
-
414
-
415
-
416
-
417
-
418
-
419
-
420
-
421
-
422
-
423
-
424
-
425
-
426
-
427
-
428
-
429
-
430
-
431
-
432
-
433
-
434
-
435
-
436
-
437
-
438
-
439
-
440
-
441
-
442
-
443
-
444
-
445
-
446
-
447
-
448
-
449
-
450
-
451
-
452
-
453
-
454
-
455
-
456
-
457
-
458
-
459
-
460
-
461
-
462
-
463
-
464
-
465
-
466
-
467
-
468
-
469
-
470
-
471
-
472
 |
 |

HSBC HOLDINGS PLC
Report of the Directors: Impact of Market Turmoil (continued)
Fair values of financial instruments > Not carried at fair value / HSBC Holdings // SPEs > HSBC-sponsored SPEs
172
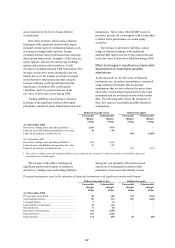
of the portfolios measured. Accordingly, these fair
values do not represent the value of these financial
instruments to HSBC as a going concern.
For all classes of financial instruments, fair
value represents the product of the value of a single
instrument, multiplied by the number of instruments
held. No block discount or premium adjustments are
made. The fair values of intangible assets related to
the businesses which originate and hold the financial
instruments subject to fair value measurement, such
as values placed on portfolios of core deposits, credit
card and customer relationships, are not included
above because they are not classified as financial
instruments. Accordingly, an aggregation of fair
value measurements does not approximate to the
value of the organisation as a going concern.
The following table lists financial instruments
whose carrying amount is a reasonable
approximation of fair value because, for example,
they are short-term in nature or reprice to current
market rates frequently:
Assets
Cash and balances at central banks
Items in the course of collection from other banks
Hong Kong Government certificates of indebtedness
Endorsements and acceptances
Short-term receivables within ‘Other assets’
Accrued income
Liabilities
Hong Kong currency notes in circulation
Items in the course of transmission to other banks
Investment contracts with discretionary participation features
within ‘Liabilities under insurance contracts’
Endorsements and acceptances
Short-term payables within ‘Other liabilities’
Accruals
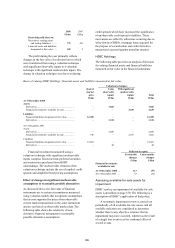
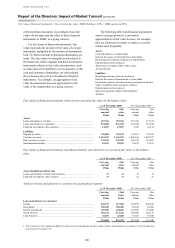
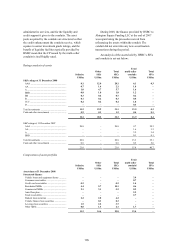
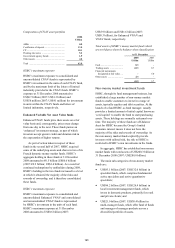
Fair values of financial instruments which are not carried at fair value on the balance sheet
At 31 December 2008 At 31 December 2007
Carrying
amount
Fair
value
Carrying
amount
Fair
value
US$m US$m US$m US$m
Assets
Loans and advances to banks ....................................................................... 153,766 153,363 237,366 237,374
Loans and advances to customers ................................................................ 932,868 876,239 981,548 951,850
Financial investments: debt securities .......................................................... 14,013 15,057 9,768 10,154
Liabilities
Deposits by banks ......................................................................................... 130,084 130,129 132,181 132,165
Customer accounts ........................................................................................ 1,115,327 1,115,291 1,096,140 1,095,727
Debt securities in issue ................................................................................. 179,693 170,599 246,579 243,802
Subordinated liabilities ................................................................................. 29,433 28,381 24,819 23,853
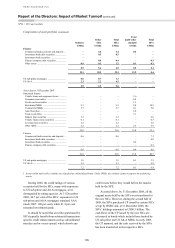
Fair values of financial investments classified as held for sale which are not carried at fair value on the balance
sheet
At 31 December 2008 At 31 December 2007
Carrying
amount
Fair
value
Carrying
amount
Fair
value
US$m US$m US$m US$m
Assets classified as held for sale
Loans and advances to banks and customers ............................................... 11 11 14 14
Financial investments: debt securities .......................................................... 37 37 27 27
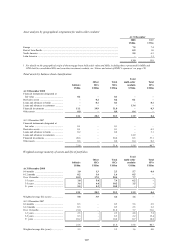
Analysis of loans and advances to customers by geographical segment
At 31 December 2008 At 31 December 2007
Carrying
amount
Fair
Value
Carrying
amount
Fair
value
US$m US$m US$m US$m
Loans and advances to customers
Europe ........................................................................................................... 426,191 417,256 452,275 450,010
Hong Kong ................................................................................................... 100,220 100,490 89,638 89,908
Rest of Asia-Pacific ...................................................................................... 107,956 104,687 101,852 101,860
North America1 ............................................................................................. 256,214 211,346 289,860 262,123
Latin America ............................................................................................... 42,287 42,460 47,923 47,949
932,868 876,239 981,548 951,850
1 The reasons for the significant difference between carrying amount and fair value of loans and advances to customers in North America
are discussed on page 170.