HSBC 2008 Annual Report Download - page 230
Download and view the complete annual report
Please find page 230 of the 2008 HSBC annual report below. You can navigate through the pages in the report by either clicking on the pages listed below, or by using the keyword search tool below to find specific information within the annual report.-
 1
1 -
2
-
3
-
4
-
5
-
6
-
7
-
8
-
9
-
10
-
11
-
12
-
13
-
14
-
15
-
16
-
17
-
18
-
19
-
20
-
21
-
22
-
23
-
24
-
25
-
26
-
27
-
28
-
29
-
30
-
31
-
32
-
33
-
34
-
35
-
36
-
37
-
38
-
39
-
40
-
41
-
42
-
43
-
44
-
45
-
46
-
47
-
48
-
49
-
50
-
51
-
52
-
53
-
54
-
55
-
56
-
57
-
58
-
59
-
60
-
61
-
62
-
63
-
64
-
65
-
66
-
67
-
68
-
69
-
70
-
71
-
72
-
73
-
74
-
75
-
76
-
77
-
78
-
79
-
80
-
81
-
82
-
83
-
84
-
85
-
86
-
87
-
88
-
89
-
90
-
91
-
92
-
93
-
94
-
95
-
96
-
97
-
98
-
99
-
100
-
101
-
102
-
103
-
104
-
105
-
106
-
107
-
108
-
109
-
110
-
111
-
112
-
113
-
114
-
115
-
116
-
117
-
118
-
119
-
120
-
121
-
122
-
123
-
124
-
125
-
126
-
127
-
128
-
129
-
130
-
131
-
132
-
133
-
134
-
135
-
136
-
137
-
138
-
139
-
140
-
141
-
142
-
143
-
144
-
145
-
146
-
147
-
148
-
149
-
150
-
151
-
152
-
153
-
154
-
155
-
156
-
157
-
158
-
159
-
160
-
161
-
162
-
163
-
164
-
165
-
166
-
167
-
168
-
169
-
170
-
171
-
172
-
173
-
174
-
175
-
176
-
177
-
178
-
179
-
180
-
181
-
182
-
183
-
184
-
185
-
186
-
187
-
188
-
189
-
190
-
191
-
192
-
193
-
194
-
195
-
196
-
197
-
198
-
199
-
200
-
201
-
202
-
203
-
204
-
205
-
206
-
207
-
208
-
209
-
210
-
211
-
212
-
213
-
214
-
215
-
216
-
217
-
218
-
219
-
 220
220 -
 221
221 -
 222
222 -
 223
223 -
 224
224 -
 225
225 -
 226
226 -
 227
227 -
 228
228 -
 229
229 -
 230
230 -
 231
231 -
 232
232 -
 233
233 -
 234
234 -
 235
235 -
 236
236 -
 237
237 -
 238
238 -
 239
239 -
 240
240 -
241
-
242
-
243
-
244
-
245
-
246
-
247
-
248
-
249
-
250
-
251
-
252
-
253
-
254
-
255
-
256
-
257
-
258
-
259
-
260
-
261
-
262
-
263
-
264
-
265
-
266
-
267
-
268
-
269
-
270
-
271
-
272
-
273
-
274
-
275
-
276
-
277
-
278
-
279
-
280
-
281
-
282
-
283
-
284
-
285
-
286
-
287
-
288
-
289
-
290
-
291
-
292
-
293
-
294
-
295
-
296
-
297
-
298
-
299
-
300
-
301
-
302
-
303
-
304
-
305
-
306
-
307
-
308
-
309
-
310
-
311
-
312
-
313
-
314
-
315
-
316
-
317
-
318
-
319
-
320
-
321
-
322
-
323
-
324
-
325
-
326
-
327
-
328
-
329
-
330
-
331
-
332
-
333
-
334
-
335
-
336
-
337
-
338
-
339
-
340
-
341
-
342
-
343
-
344
-
345
-
346
-
347
-
348
-
349
-
350
-
351
-
352
-
353
-
354
-
355
-
356
-
357
-
358
-
359
-
360
-
361
-
362
-
363
-
364
-
365
-
366
-
367
-
368
-
369
-
370
-
371
-
372
-
373
-
374
-
375
-
376
-
377
-
378
-
379
-
380
-
381
-
382
-
383
-
384
-
385
-
386
-
387
-
388
-
389
-
390
-
391
-
392
-
393
-
394
-
395
-
396
-
397
-
398
-
399
-
400
-
401
-
402
-
403
-
404
-
405
-
406
-
407
-
408
-
409
-
410
-
411
-
412
-
413
-
414
-
415
-
416
-
417
-
418
-
419
-
420
-
421
-
422
-
423
-
424
-
425
-
426
-
427
-
428
-
429
-
430
-
431
-
432
-
433
-
434
-
435
-
436
-
437
-
438
-
439
-
440
-
441
-
442
-
443
-
444
-
445
-
446
-
447
-
448
-
449
-
450
-
451
-
452
-
453
-
454
-
455
-
456
-
457
-
458
-
459
-
460
-
461
-
462
-
463
-
464
-
465
-
466
-
467
-
468
-
469
-
470
-
471
-
472
 |
 |

HSBC HOLDINGS PLC
Report of the Directors: Risk (continued)
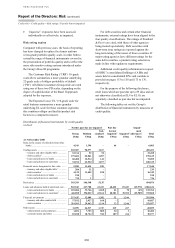
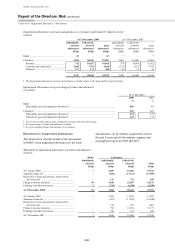
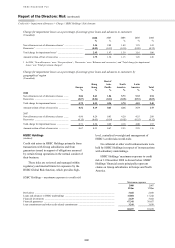
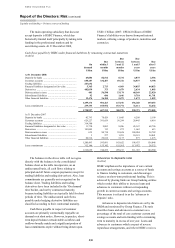
Credit risk > Impairment allowances > Charge / 2008
228
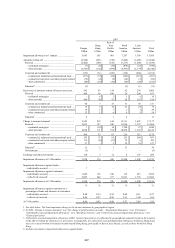
Individually and collectively assessed charge to impairment allowances by industry segment
(Unaudited)
2008 2007
Individually
assessed
US$m
Collectively
assessed
US$m
Total
US$m
Individually
assessed
US$m
Collectively
assessed
US$m
Total
US$m
Banks .................................................................. 54 – 54 – – –
Personal ............................................................... 110 20,840 20,950 54 15,914 15,968
Residential mortgages .................................... 26 4,974 5,000 13 1,827 1,840
Other personal ................................................ 84 15,866 15,950 41 14,087 14,128
Corporate and commercial ................................. 1,782 1,097 2,879 722 451 1,173
Commercial, industrial and international
trade ............................................................ 912 661 1,573 584 313 897
Commercial real estate and other
property-related .......................................... 613 142 755 84 67 151
Other commercial ........................................... 257 294 551 54 71 125
Financial ............................................................. 118 130 248 20 16 36
Total charge to income statement ....................... 2,064 22,067 24,131 796 16,381 17,177
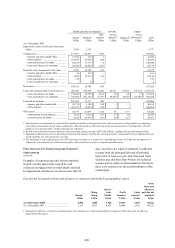
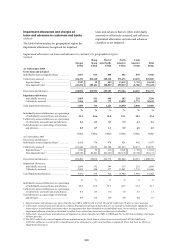
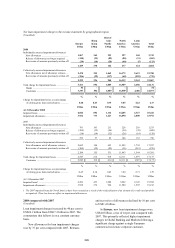
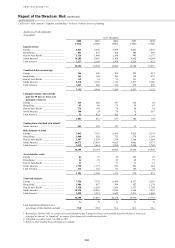
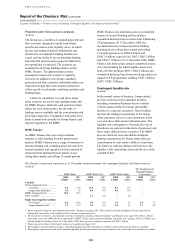
Charge for impairment losses
The following tables analysing the net loan
impairment charge to the income statement are
followed by a discussion of the material movements
in loan impairment charges by region.
Net loan impairment charge to the income statement
(Unaudited)
2008 2007 2006 2005 2004
US$m US$m US$m US$m US$m
Individually assessed impairment allowances1
New allowances ....................................................................... 2,742 1,533 1,297 1,715 8,872
Release of allowances no longer required .............................. (565) (608) (711) (998) (1,266)
Recoveries of amounts previously written off ........................ (113) (129) (128) (199) (913)
2,064 796 458 518 6,693
Collectively assessed impairment allowances1
New allowances net of allowance releases ............................. 22,788 17,257 10,740 8,425 –
Release of allowances no longer required .............................. – – – (788) –
Recoveries of amounts previously written off ........................ (721) (876) (651) (295) –
General provisions ................................................................... – – – – (498)
22,067 16,381 10,089 7,342 (498)
Total charge for impairment losses1 ............................................ 24,131 17,177 10,547 7,860 6,195
Banks ...................................................................................... 54 – (3) (7) (10)
Customers ............................................................................... 24,077 17,177 10,550 7,867 6,205
% % % % %
Charge for impairment losses as a percentage of closing
gross loans and advances1 ...................................................... 2.17 1.39 0.99 0.90 0.91
US$m US$m US$m US$m US$m
At 31 December
Impaired loans1,2 .......................................................................... 25,422 19,594 15,086 12,360 13,057
Impairment allowances1 .............................................................. 23,972 19,212 13,585 11,366 12,542
1 In 2004, ‘Individually assessed impairment allowances’ were ‘Specific provisions’; ‘Collectively assessed impairment allowances’ were
‘General provisions’; ‘Total charge for impairment losses’ was ‘Bad and doubtful debt charge’; ‘Impaired loans’ were ‘Non-
performing loans’ and ‘Impairment allowances’ were ‘Provisions’.
2 Impaired loans for 2007 have been restated as a result of the reclassification of an element of a credit card portfolio as impaired. There
has been no effect on impairment allowances.