HSBC 2008 Annual Report Download - page 215
Download and view the complete annual report
Please find page 215 of the 2008 HSBC annual report below. You can navigate through the pages in the report by either clicking on the pages listed below, or by using the keyword search tool below to find specific information within the annual report.-
 1
1 -
2
-
3
-
4
-
5
-
6
-
7
-
8
-
9
-
10
-
11
-
12
-
13
-
14
-
15
-
16
-
17
-
18
-
19
-
20
-
21
-
22
-
23
-
24
-
25
-
26
-
27
-
28
-
29
-
30
-
31
-
32
-
33
-
34
-
35
-
36
-
37
-
38
-
39
-
40
-
41
-
42
-
43
-
44
-
45
-
46
-
47
-
48
-
49
-
50
-
51
-
52
-
53
-
54
-
55
-
56
-
57
-
58
-
59
-
60
-
61
-
62
-
63
-
64
-
65
-
66
-
67
-
68
-
69
-
70
-
71
-
72
-
73
-
74
-
75
-
76
-
77
-
78
-
79
-
80
-
81
-
82
-
83
-
84
-
85
-
86
-
87
-
88
-
89
-
90
-
91
-
92
-
93
-
94
-
95
-
96
-
97
-
98
-
99
-
100
-
101
-
102
-
103
-
104
-
105
-
106
-
107
-
108
-
109
-
110
-
111
-
112
-
113
-
114
-
115
-
116
-
117
-
118
-
119
-
120
-
121
-
122
-
123
-
124
-
125
-
126
-
127
-
128
-
129
-
130
-
131
-
132
-
133
-
134
-
135
-
136
-
137
-
138
-
139
-
140
-
141
-
142
-
143
-
144
-
145
-
146
-
147
-
148
-
149
-
150
-
151
-
152
-
153
-
154
-
155
-
156
-
157
-
158
-
159
-
160
-
161
-
162
-
163
-
164
-
165
-
166
-
167
-
168
-
169
-
170
-
171
-
172
-
173
-
174
-
175
-
176
-
177
-
178
-
179
-
180
-
181
-
182
-
183
-
184
-
185
-
186
-
187
-
188
-
189
-
190
-
191
-
192
-
193
-
194
-
195
-
196
-
197
-
198
-
199
-
200
-
201
-
202
-
203
-
204
-
 205
205 -
 206
206 -
 207
207 -
 208
208 -
 209
209 -
 210
210 -
 211
211 -
 212
212 -
 213
213 -
 214
214 -
 215
215 -
 216
216 -
 217
217 -
 218
218 -
 219
219 -
 220
220 -
 221
221 -
 222
222 -
 223
223 -
 224
224 -
 225
225 -
226
-
227
-
228
-
229
-
230
-
231
-
232
-
233
-
234
-
235
-
236
-
237
-
238
-
239
-
240
-
241
-
242
-
243
-
244
-
245
-
246
-
247
-
248
-
249
-
250
-
251
-
252
-
253
-
254
-
255
-
256
-
257
-
258
-
259
-
260
-
261
-
262
-
263
-
264
-
265
-
266
-
267
-
268
-
269
-
270
-
271
-
272
-
273
-
274
-
275
-
276
-
277
-
278
-
279
-
280
-
281
-
282
-
283
-
284
-
285
-
286
-
287
-
288
-
289
-
290
-
291
-
292
-
293
-
294
-
295
-
296
-
297
-
298
-
299
-
300
-
301
-
302
-
303
-
304
-
305
-
306
-
307
-
308
-
309
-
310
-
311
-
312
-
313
-
314
-
315
-
316
-
317
-
318
-
319
-
320
-
321
-
322
-
323
-
324
-
325
-
326
-
327
-
328
-
329
-
330
-
331
-
332
-
333
-
334
-
335
-
336
-
337
-
338
-
339
-
340
-
341
-
342
-
343
-
344
-
345
-
346
-
347
-
348
-
349
-
350
-
351
-
352
-
353
-
354
-
355
-
356
-
357
-
358
-
359
-
360
-
361
-
362
-
363
-
364
-
365
-
366
-
367
-
368
-
369
-
370
-
371
-
372
-
373
-
374
-
375
-
376
-
377
-
378
-
379
-
380
-
381
-
382
-
383
-
384
-
385
-
386
-
387
-
388
-
389
-
390
-
391
-
392
-
393
-
394
-
395
-
396
-
397
-
398
-
399
-
400
-
401
-
402
-
403
-
404
-
405
-
406
-
407
-
408
-
409
-
410
-
411
-
412
-
413
-
414
-
415
-
416
-
417
-
418
-
419
-
420
-
421
-
422
-
423
-
424
-
425
-
426
-
427
-
428
-
429
-
430
-
431
-
432
-
433
-
434
-
435
-
436
-
437
-
438
-
439
-
440
-
441
-
442
-
443
-
444
-
445
-
446
-
447
-
448
-
449
-
450
-
451
-
452
-
453
-
454
-
455
-
456
-
457
-
458
-
459
-
460
-
461
-
462
-
463
-
464
-
465
-
466
-
467
-
468
-
469
-
470
-
471
-
472
 |
 |

213
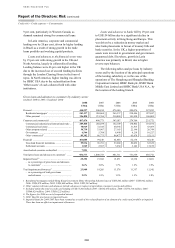
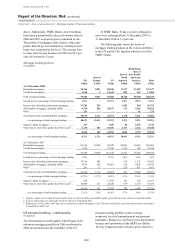
decline of 19 per cent in 2008). These factors
restricted the ability of many customers to refinance
and access equity retained in their homes.
Two months or more delinquencies in
mortgages originated through the HSBC Finance
branch network rose most rapidly in those states
most severely affected by continued house price
depreciation and rising unemployment, particularly
in California, Florida, New York, Virginia,
Maryland, New Jersey, Illinois, Pennsylvania,
Massachusetts and Ohio.
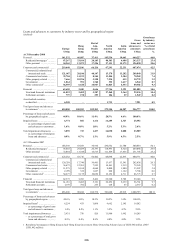
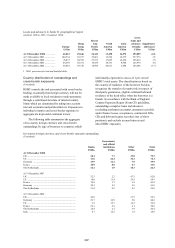
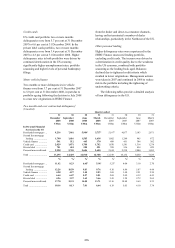
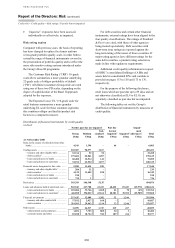
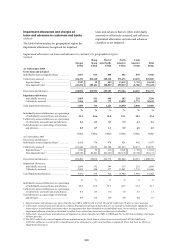
HSBC Finance: geographical concentration of US lending1,2
(Unaudited)
Mortgage lending as a
percentage of:
Other personal lending as a
percentage of:
total
lending
total
mortgage
lending
total
lending
total other
personal
lending
Percentage
of total
lending
% % % % %
California ............................................................................... 6 11 6 12 12
Florida .................................................................................... 4 7 3 7 7
New York ............................................................................... 3 6 3 6 6
Texas ...................................................................................... 2 3 4 8 6
Ohio ....................................................................................... 3 5 2 5 5
Pennsylvania .......................................................................... 3 5 2 5 5
1 By states which individually account for 5 per cent or more of HSBC Finance’s US customer loan portfolio.
2 HSBC Finance lending is shown on a management basis and includes loans transferred to HSBC USA Inc, which are managed by
HSBC Finance.
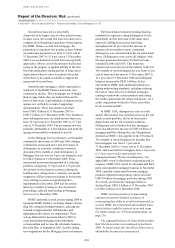
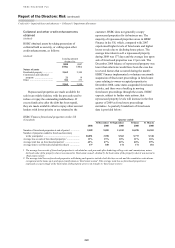
In the US real estate secured portfolios, two
months and over contractual delinquency ratios at
the end of 2008 were higher across the portfolio
than during 2007 and the first half of 2008, for
the reasons described above. There was also a
significant effect on delinquency ratios from
declining balances. As the portfolios aged,
outstanding balances fell as new lending in certain
portfolios ceased, risk mitigation efforts and changes
to product offerings which began in 2007 and
continued in 2008 resulted in lower originations
and US$8.2 billion in mortgage portfolios were
sold during the year.
Both dollar and percentage two months and over
contractual delinquency in the real estate secured
portfolios of HSBC Finance and HSBC USA
increased following a voluntary one month
suspension of final court proceedings in foreclosure
cases relating to owner-occupied properties,
implemented in December 2008, which was in
addition to actions taken by a number of states to
slow foreclosure proceedings. Within these
portfolios, dollar delinquencies rose sharply in 2008
as credit quality in the consumer lending portfolio,
most notably for first lien products, and in Mortgage
Services, continued to deteriorate, particularly in the
second half of the year. In Mortgage Services, the
rise in the fourth quarter of 2008 was despite lower
balances following portfolio run-off and the sale of
portfolios during the year, and was partly caused by
the above-mentioned action on foreclosure.
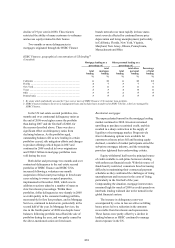
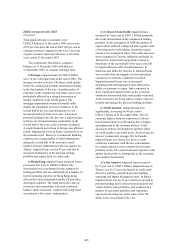
Residential mortgages
The unprecedented turmoil in the mortgage lending
market continued in 2008. Investors remained
unwilling to purchase securitised credit, and this
resulted in a sharp contraction in the supply of
liquidity to the mortgage market. Progressively
fewer refinancing options were available for
customers as house prices fell and housing equity
declined, a number of market participants exited the
sub-prime mortgage industry, and the remaining
providers tightened their underwriting criteria.
Equity withdrawal had been the principal source
of credit available to sub-prime borrowers dealing
with unforeseen financial needs. With this source of
funds heavily restricted, consumers faced increasing
difficulty in maintaining their contractual payment
schedules as they confronted the challenges of rising
unemployment and increases in the costs of living,
particularly in the first half of the year.
Compounding the situation, mortgage interest rates
remained high for much of 2008 as credit spreads on
interbank lending widened due to the turmoil in the
global financial system.
The increase in delinquency rates was
accompanied by a rise in loss severities as falling
house prices led to a reduction in the amounts
recoverable from foreclosure and repossession.
These factors were partly offset by a decline in
lending balances as HSBC continued to manage
down exposure in the US.