HSBC 2008 Annual Report Download - page 200
Download and view the complete annual report
Please find page 200 of the 2008 HSBC annual report below. You can navigate through the pages in the report by either clicking on the pages listed below, or by using the keyword search tool below to find specific information within the annual report.-
 1
1 -
2
-
3
-
4
-
5
-
6
-
7
-
8
-
9
-
10
-
11
-
12
-
13
-
14
-
15
-
16
-
17
-
18
-
19
-
20
-
21
-
22
-
23
-
24
-
25
-
26
-
27
-
28
-
29
-
30
-
31
-
32
-
33
-
34
-
35
-
36
-
37
-
38
-
39
-
40
-
41
-
42
-
43
-
44
-
45
-
46
-
47
-
48
-
49
-
50
-
51
-
52
-
53
-
54
-
55
-
56
-
57
-
58
-
59
-
60
-
61
-
62
-
63
-
64
-
65
-
66
-
67
-
68
-
69
-
70
-
71
-
72
-
73
-
74
-
75
-
76
-
77
-
78
-
79
-
80
-
81
-
82
-
83
-
84
-
85
-
86
-
87
-
88
-
89
-
90
-
91
-
92
-
93
-
94
-
95
-
96
-
97
-
98
-
99
-
100
-
101
-
102
-
103
-
104
-
105
-
106
-
107
-
108
-
109
-
110
-
111
-
112
-
113
-
114
-
115
-
116
-
117
-
118
-
119
-
120
-
121
-
122
-
123
-
124
-
125
-
126
-
127
-
128
-
129
-
130
-
131
-
132
-
133
-
134
-
135
-
136
-
137
-
138
-
139
-
140
-
141
-
142
-
143
-
144
-
145
-
146
-
147
-
148
-
149
-
150
-
151
-
152
-
153
-
154
-
155
-
156
-
157
-
158
-
159
-
160
-
161
-
162
-
163
-
164
-
165
-
166
-
167
-
168
-
169
-
170
-
171
-
172
-
173
-
174
-
175
-
176
-
177
-
178
-
179
-
180
-
181
-
182
-
183
-
184
-
185
-
186
-
187
-
188
-
189
-
 190
190 -
 191
191 -
 192
192 -
 193
193 -
 194
194 -
 195
195 -
 196
196 -
 197
197 -
 198
198 -
 199
199 -
 200
200 -
 201
201 -
 202
202 -
 203
203 -
 204
204 -
 205
205 -
 206
206 -
 207
207 -
 208
208 -
 209
209 -
 210
210 -
211
-
212
-
213
-
214
-
215
-
216
-
217
-
218
-
219
-
220
-
221
-
222
-
223
-
224
-
225
-
226
-
227
-
228
-
229
-
230
-
231
-
232
-
233
-
234
-
235
-
236
-
237
-
238
-
239
-
240
-
241
-
242
-
243
-
244
-
245
-
246
-
247
-
248
-
249
-
250
-
251
-
252
-
253
-
254
-
255
-
256
-
257
-
258
-
259
-
260
-
261
-
262
-
263
-
264
-
265
-
266
-
267
-
268
-
269
-
270
-
271
-
272
-
273
-
274
-
275
-
276
-
277
-
278
-
279
-
280
-
281
-
282
-
283
-
284
-
285
-
286
-
287
-
288
-
289
-
290
-
291
-
292
-
293
-
294
-
295
-
296
-
297
-
298
-
299
-
300
-
301
-
302
-
303
-
304
-
305
-
306
-
307
-
308
-
309
-
310
-
311
-
312
-
313
-
314
-
315
-
316
-
317
-
318
-
319
-
320
-
321
-
322
-
323
-
324
-
325
-
326
-
327
-
328
-
329
-
330
-
331
-
332
-
333
-
334
-
335
-
336
-
337
-
338
-
339
-
340
-
341
-
342
-
343
-
344
-
345
-
346
-
347
-
348
-
349
-
350
-
351
-
352
-
353
-
354
-
355
-
356
-
357
-
358
-
359
-
360
-
361
-
362
-
363
-
364
-
365
-
366
-
367
-
368
-
369
-
370
-
371
-
372
-
373
-
374
-
375
-
376
-
377
-
378
-
379
-
380
-
381
-
382
-
383
-
384
-
385
-
386
-
387
-
388
-
389
-
390
-
391
-
392
-
393
-
394
-
395
-
396
-
397
-
398
-
399
-
400
-
401
-
402
-
403
-
404
-
405
-
406
-
407
-
408
-
409
-
410
-
411
-
412
-
413
-
414
-
415
-
416
-
417
-
418
-
419
-
420
-
421
-
422
-
423
-
424
-
425
-
426
-
427
-
428
-
429
-
430
-
431
-
432
-
433
-
434
-
435
-
436
-
437
-
438
-
439
-
440
-
441
-
442
-
443
-
444
-
445
-
446
-
447
-
448
-
449
-
450
-
451
-
452
-
453
-
454
-
455
-
456
-
457
-
458
-
459
-
460
-
461
-
462
-
463
-
464
-
465
-
466
-
467
-
468
-
469
-
470
-
471
-
472
 |
 |

HSBC HOLDINGS PLC
Report of the Directors: Risk (continued)
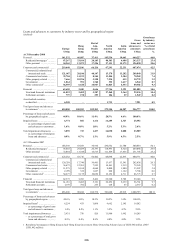
Credit risk > Credit exposure > Maximum exposure / Collateral
198
assets, loans and advances to customers, loans and
advances to banks, and financial investments.
The balance of exposure at 31 December 2008
represented a change in risk profile compared with a
year ago as HSBC repositioned its balance sheet in
the face of unprecedented turmoil in financial
markets. The following commentary is on a constant
currency basis.
Derivative asset balances rose significantly as
the financial turmoil of 2008 led to heightened levels
of volatility in the underlying markets to which the
derivatives are referenced. The rise in asset balances
was primarily driven by interest rate derivatives as
the global fall in interest reference rates created
significant gaps between the fixed and floating
components of interest rate swaps, which in turn led
to substantial mark-to-market increases in the value
of interest rate swap positions. The widening credit
spreads and significant volatility in credit and
foreign exchange markets created the environment in
which credit derivative positions and foreign
exchange derivative assets increased.
HSBC reduced exposure to banks as it tightened
lending limits in response to declining credit quality.
Much of this lending was instead placed into
government issued or guaranteed debt, which
contributed to an increase in financial investments.
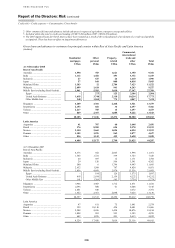
Loans and advances to customers in the
commercial sector grew while personal lending
declined, primarily due to the continued run-off of
parts of the portfolio in North America. Amounts
due from non-bank financial institutions increased
due to the expansion of reverse repo lending with
the London Clearing House in the UK and a
reclassification of cash collateral in the US.
Within trading assets, debt securities and
treasury and other bills increased, primarily due to
the consolidation on 30 September 2008 of five
Constant Net Asset Value funds containing assets
upon consolidation of around US$40 billion held for
trading. For further details see pages 180 to 181.
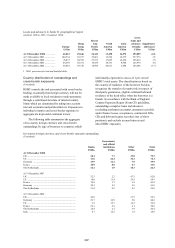
As a consequence of the significant increase in
derivative balances, there was a decline in the
proportion of total assets represented by most other
asset classes. On a reported basis, the proportion of
total assets represented by derivative assets increased
by 12 percentage points while that deployed in loans
and advances to customers declined by 5 percentage
points and the proportion of trading assets declined
by 2 percentage points. Loans and advances to
banks as a proportion of total assets declined by
4 percentage points.
The most significant factor affecting HSBC’s
exposure to credit risk during 2008 was the
continuing deterioration in credit conditions in the
US mortgage market. HSBC also experienced
deterioration in credit quality in the commercial real
estate sector. Loss experience remained concentrated
in the personal lending portfolios, primarily in the
US with 85 per cent of loan impairment charges and
other credit risk provisions arising in Personal
Financial Services in 2008 compared with 94 per
cent in 2007. In 2008, 9 per cent of loan impairment
charges and other credit risk provisions arose in
Commercial Banking, compared with 6 per cent in
2007. In the UK, despite significant declines in
house prices and activity in the housing market as a
whole, the credit quality of HSBC’s mortgage
business remained materially stable in 2008.
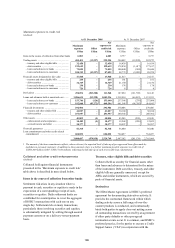
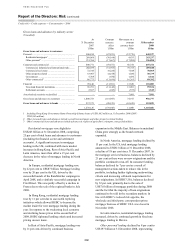
The following table presents the maximum
exposure to credit risk from balance sheet and off-
balance sheet financial instruments, before taking
account of any collateral held or other credit
enhancements (unless such credit enhancements
meet offsetting requirements). For financial assets
recognised on the balance sheet, the maximum
exposure to credit risk equals their carrying amount;
for financial guarantees granted, it is the maximum
amount that HSBC would have to pay if the
guarantees were called upon. For loan commitments
and other credit-related commitments that are
irrevocable over the life of the respective facilities,
it is the full amount of the committed facilities.