HSBC 2008 Annual Report Download - page 364
Download and view the complete annual report
Please find page 364 of the 2008 HSBC annual report below. You can navigate through the pages in the report by either clicking on the pages listed below, or by using the keyword search tool below to find specific information within the annual report.-
 1
1 -
2
-
3
-
4
-
5
-
6
-
7
-
8
-
9
-
10
-
11
-
12
-
13
-
14
-
15
-
16
-
17
-
18
-
19
-
20
-
21
-
22
-
23
-
24
-
25
-
26
-
27
-
28
-
29
-
30
-
31
-
32
-
33
-
34
-
35
-
36
-
37
-
38
-
39
-
40
-
41
-
42
-
43
-
44
-
45
-
46
-
47
-
48
-
49
-
50
-
51
-
52
-
53
-
54
-
55
-
56
-
57
-
58
-
59
-
60
-
61
-
62
-
63
-
64
-
65
-
66
-
67
-
68
-
69
-
70
-
71
-
72
-
73
-
74
-
75
-
76
-
77
-
78
-
79
-
80
-
81
-
82
-
83
-
84
-
85
-
86
-
87
-
88
-
89
-
90
-
91
-
92
-
93
-
94
-
95
-
96
-
97
-
98
-
99
-
100
-
101
-
102
-
103
-
104
-
105
-
106
-
107
-
108
-
109
-
110
-
111
-
112
-
113
-
114
-
115
-
116
-
117
-
118
-
119
-
120
-
121
-
122
-
123
-
124
-
125
-
126
-
127
-
128
-
129
-
130
-
131
-
132
-
133
-
134
-
135
-
136
-
137
-
138
-
139
-
140
-
141
-
142
-
143
-
144
-
145
-
146
-
147
-
148
-
149
-
150
-
151
-
152
-
153
-
154
-
155
-
156
-
157
-
158
-
159
-
160
-
161
-
162
-
163
-
164
-
165
-
166
-
167
-
168
-
169
-
170
-
171
-
172
-
173
-
174
-
175
-
176
-
177
-
178
-
179
-
180
-
181
-
182
-
183
-
184
-
185
-
186
-
187
-
188
-
189
-
190
-
191
-
192
-
193
-
194
-
195
-
196
-
197
-
198
-
199
-
200
-
201
-
202
-
203
-
204
-
205
-
206
-
207
-
208
-
209
-
210
-
211
-
212
-
213
-
214
-
215
-
216
-
217
-
218
-
219
-
220
-
221
-
222
-
223
-
224
-
225
-
226
-
227
-
228
-
229
-
230
-
231
-
232
-
233
-
234
-
235
-
236
-
237
-
238
-
239
-
240
-
241
-
242
-
243
-
244
-
245
-
246
-
247
-
248
-
249
-
250
-
251
-
252
-
253
-
254
-
255
-
256
-
257
-
258
-
259
-
260
-
261
-
262
-
263
-
264
-
265
-
266
-
267
-
268
-
269
-
270
-
271
-
272
-
273
-
274
-
275
-
276
-
277
-
278
-
279
-
280
-
281
-
282
-
283
-
284
-
285
-
286
-
287
-
288
-
289
-
290
-
291
-
292
-
293
-
294
-
295
-
296
-
297
-
298
-
299
-
300
-
301
-
302
-
303
-
304
-
305
-
306
-
307
-
308
-
309
-
310
-
311
-
312
-
313
-
314
-
315
-
316
-
317
-
318
-
319
-
320
-
321
-
322
-
323
-
324
-
325
-
326
-
327
-
328
-
329
-
330
-
331
-
332
-
333
-
334
-
335
-
336
-
337
-
338
-
339
-
340
-
341
-
342
-
343
-
344
-
345
-
346
-
347
-
348
-
349
-
350
-
351
-
352
-
353
-
 354
354 -
 355
355 -
 356
356 -
 357
357 -
 358
358 -
 359
359 -
 360
360 -
 361
361 -
 362
362 -
 363
363 -
 364
364 -
 365
365 -
 366
366 -
 367
367 -
 368
368 -
 369
369 -
 370
370 -
 371
371 -
 372
372 -
 373
373 -
 374
374 -
375
-
376
-
377
-
378
-
379
-
380
-
381
-
382
-
383
-
384
-
385
-
386
-
387
-
388
-
389
-
390
-
391
-
392
-
393
-
394
-
395
-
396
-
397
-
398
-
399
-
400
-
401
-
402
-
403
-
404
-
405
-
406
-
407
-
408
-
409
-
410
-
411
-
412
-
413
-
414
-
415
-
416
-
417
-
418
-
419
-
420
-
421
-
422
-
423
-
424
-
425
-
426
-
427
-
428
-
429
-
430
-
431
-
432
-
433
-
434
-
435
-
436
-
437
-
438
-
439
-
440
-
441
-
442
-
443
-
444
-
445
-
446
-
447
-
448
-
449
-
450
-
451
-
452
-
453
-
454
-
455
-
456
-
457
-
458
-
459
-
460
-
461
-
462
-
463
-
464
-
465
-
466
-
467
-
468
-
469
-
470
-
471
-
472
 |
 |

HSBC HOLDINGS PLC
Notes on the Financial Statements (continued)
Notes 6, 7 and 8
362
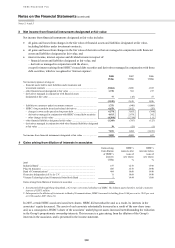
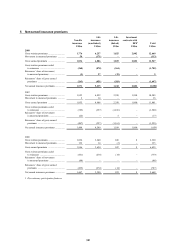
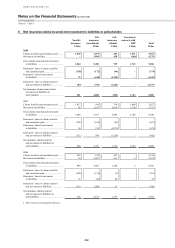
6 Net insurance claims incurred and movement in liabilities to policyholders
Non-life
insurance
Life
insurance
(non-linked)
Life
insurance
(linked)
Investment
contracts with
DPF1 Total
US$m US$m US$m US$m US$m
2008
Claims, benefits and surrenders paid ........ 1,044 1,491 481 1,911 4,927
Movement in liabilities ............................. – 3,989 458 (168) 4,279
Gross claims incurred and movement
in liabilities ........................................... 1,044 5,480 939 1,743 9,206
Reinsurers’ share of claims, benefits
and surrenders paid ............................... (158) (172) (44) – (374)
Reinsurers’ share of movement
in liabilities ........................................... 75 (620) (1,398) – (1,943)
Reinsurers’ share of claims incurred
and movement in liabilities ................... (83) (792) (1,442) – (2,317)
Net insurance claims incurred and
movement in liabilities to
policyholders ........................................ 961 4,688 (503) 1,743 6,889
2007
Claims, benefits and surrenders paid ........ 1,017 940 790 1,080 3,827
Movement in liabilities ............................. 82 2,437 2,096 1,108 5,723
Gross claims incurred and movement
in liabilities ........................................... 1,099 3,377 2,886 2,188 9,550
Reinsurers’ share of claims, benefits
and surrenders paid ............................... (207) (169) (45) – (421)
Reinsurers’ share of movement
in liabilities ........................................... 36 518 (1,075) – (521)
Reinsurers’ share of claims incurred
and movement in liabilities .................. (171) 349 (1,120) – (942)
Net insurance claims incurred
and movement in liabilities to
policyholders ........................................ 928 3,726 1,766 2,188 8,608
2006
Claims, benefits and surrenders paid ........ 889 814 495 – 2,198
Movement in liabilities ............................. 10 2,207 651 6 2,874
Gross claims incurred and movement
in liabilities ........................................... 899 3,021 1,146 6 5,072
Reinsurers’ share of claims, benefits
and surrenders paid ............................... (228) (154) (9) – (391)
Reinsurers’ share of movement
in liabilities ........................................... 57 (54) 20 – 23
Reinsurers’ share of claims incurred
and movement in liabilities .................. (171) (208) 11 – (368)
Net insurance claims incurred
and movement in liabilities to
policyholders ........................................ 728 2,813 1,157 6 4,704
1 Discretionary participation features.