HSBC 2008 Annual Report Download - page 209
Download and view the complete annual report
Please find page 209 of the 2008 HSBC annual report below. You can navigate through the pages in the report by either clicking on the pages listed below, or by using the keyword search tool below to find specific information within the annual report.-
 1
1 -
2
-
3
-
4
-
5
-
6
-
7
-
8
-
9
-
10
-
11
-
12
-
13
-
14
-
15
-
16
-
17
-
18
-
19
-
20
-
21
-
22
-
23
-
24
-
25
-
26
-
27
-
28
-
29
-
30
-
31
-
32
-
33
-
34
-
35
-
36
-
37
-
38
-
39
-
40
-
41
-
42
-
43
-
44
-
45
-
46
-
47
-
48
-
49
-
50
-
51
-
52
-
53
-
54
-
55
-
56
-
57
-
58
-
59
-
60
-
61
-
62
-
63
-
64
-
65
-
66
-
67
-
68
-
69
-
70
-
71
-
72
-
73
-
74
-
75
-
76
-
77
-
78
-
79
-
80
-
81
-
82
-
83
-
84
-
85
-
86
-
87
-
88
-
89
-
90
-
91
-
92
-
93
-
94
-
95
-
96
-
97
-
98
-
99
-
100
-
101
-
102
-
103
-
104
-
105
-
106
-
107
-
108
-
109
-
110
-
111
-
112
-
113
-
114
-
115
-
116
-
117
-
118
-
119
-
120
-
121
-
122
-
123
-
124
-
125
-
126
-
127
-
128
-
129
-
130
-
131
-
132
-
133
-
134
-
135
-
136
-
137
-
138
-
139
-
140
-
141
-
142
-
143
-
144
-
145
-
146
-
147
-
148
-
149
-
150
-
151
-
152
-
153
-
154
-
155
-
156
-
157
-
158
-
159
-
160
-
161
-
162
-
163
-
164
-
165
-
166
-
167
-
168
-
169
-
170
-
171
-
172
-
173
-
174
-
175
-
176
-
177
-
178
-
179
-
180
-
181
-
182
-
183
-
184
-
185
-
186
-
187
-
188
-
189
-
190
-
191
-
192
-
193
-
194
-
195
-
196
-
197
-
198
-
 199
199 -
 200
200 -
 201
201 -
 202
202 -
 203
203 -
 204
204 -
 205
205 -
 206
206 -
 207
207 -
 208
208 -
 209
209 -
 210
210 -
 211
211 -
 212
212 -
 213
213 -
 214
214 -
 215
215 -
 216
216 -
 217
217 -
 218
218 -
 219
219 -
220
-
221
-
222
-
223
-
224
-
225
-
226
-
227
-
228
-
229
-
230
-
231
-
232
-
233
-
234
-
235
-
236
-
237
-
238
-
239
-
240
-
241
-
242
-
243
-
244
-
245
-
246
-
247
-
248
-
249
-
250
-
251
-
252
-
253
-
254
-
255
-
256
-
257
-
258
-
259
-
260
-
261
-
262
-
263
-
264
-
265
-
266
-
267
-
268
-
269
-
270
-
271
-
272
-
273
-
274
-
275
-
276
-
277
-
278
-
279
-
280
-
281
-
282
-
283
-
284
-
285
-
286
-
287
-
288
-
289
-
290
-
291
-
292
-
293
-
294
-
295
-
296
-
297
-
298
-
299
-
300
-
301
-
302
-
303
-
304
-
305
-
306
-
307
-
308
-
309
-
310
-
311
-
312
-
313
-
314
-
315
-
316
-
317
-
318
-
319
-
320
-
321
-
322
-
323
-
324
-
325
-
326
-
327
-
328
-
329
-
330
-
331
-
332
-
333
-
334
-
335
-
336
-
337
-
338
-
339
-
340
-
341
-
342
-
343
-
344
-
345
-
346
-
347
-
348
-
349
-
350
-
351
-
352
-
353
-
354
-
355
-
356
-
357
-
358
-
359
-
360
-
361
-
362
-
363
-
364
-
365
-
366
-
367
-
368
-
369
-
370
-
371
-
372
-
373
-
374
-
375
-
376
-
377
-
378
-
379
-
380
-
381
-
382
-
383
-
384
-
385
-
386
-
387
-
388
-
389
-
390
-
391
-
392
-
393
-
394
-
395
-
396
-
397
-
398
-
399
-
400
-
401
-
402
-
403
-
404
-
405
-
406
-
407
-
408
-
409
-
410
-
411
-
412
-
413
-
414
-
415
-
416
-
417
-
418
-
419
-
420
-
421
-
422
-
423
-
424
-
425
-
426
-
427
-
428
-
429
-
430
-
431
-
432
-
433
-
434
-
435
-
436
-
437
-
438
-
439
-
440
-
441
-
442
-
443
-
444
-
445
-
446
-
447
-
448
-
449
-
450
-
451
-
452
-
453
-
454
-
455
-
456
-
457
-
458
-
459
-
460
-
461
-
462
-
463
-
464
-
465
-
466
-
467
-
468
-
469
-
470
-
471
-
472
 |
 |
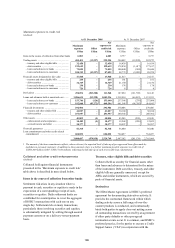
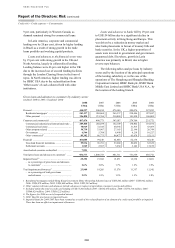
207
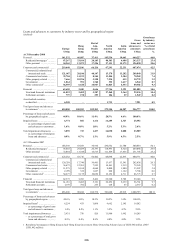
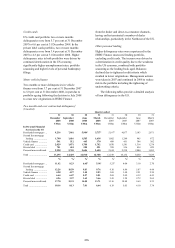
Loans and advances to banks by geographical region
(Audited: 2008 to 2005; Unaudited: 2004)
Europe
Hong
Kong
Rest of
Asia-
Pacific
North
America
Latin
America
Gross
loans and
advances
to banks
Impairment
allowances1
US$m US$m US$m US$m US$m US$m US$m
At 31 December 2008 ................ 62,012 29,646 36,141 11,458 14,572 153,829 (63)
At 31 December 2007 .................. 104,534 63,737 39,861 16,566 12,675 237,373 (7)
At 31 December 2006 .................. 76,837 50,359 27,517 17,865 12,634 185,212 (7)
At 31 December 2005 .................. 44,369 42,751 19,559 10,331 8,964 125,974 (9)
At 31 December 2004 .................. 56,063 45,710 14,890 20,911 5,892 143,466 (17)
1 2004: provisions for bad and doubtful debts.
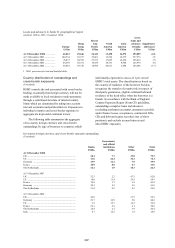
Country distribution of outstandings and
cross-border exposures
(Unaudited)
HSBC controls the risk associated with cross-border
lending, essentially that foreign currency will not be
made available to local residents to make payments,
through a centralised structure of internal country
limits which are determined by taking into account
relevant economic and political factors. Exposures to
individual countries and cross-border exposure in
aggregate are kept under continual review.
The following table summarises the aggregate
of in-country foreign currency and cross-border
outstandings by type of borrower to countries which
individually represent in excess of 1 per cent of
HSBC’s total assets. The classification is based on
the country of residence of the borrower but also
recognises the transfer of country risk in respect of
third-party guarantees, eligible collateral held and
residence of the head office when the borrower is a
branch. In accordance with the Bank of England
Country Exposure Report (Form CE) guidelines,
outstandings comprise loans and advances
(excluding settlement accounts), amounts receivable
under finance leases, acceptances, commercial bills,
CDs and debt and equity securities (net of short
positions), and exclude accrued interest and
intra-HSBC exposures.
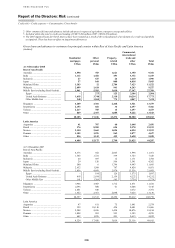
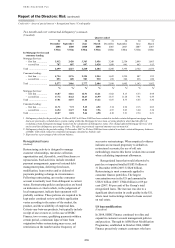
In-country foreign currency and cross-border amounts outstanding
(Unaudited)
Banks
Government
and official
institutions Other Total
US$bn US$bn US$bn US$bn
At 31 December 2008
UK ................................................................................... 38.4 7.1 33.8 79.3
US ................................................................................... 13.6 26.4 34.1 74.1
Germany ......................................................................... 19.9 12.1 7.9 39.9
France ............................................................................. 18.9 8.0 6.7 33.6
The Netherlands .............................................................. 14.1 1.9 10.3 26.3
At 31 December 2007
UK ................................................................................... 32.3 2.2 47.5 82.0
US ................................................................................... 14.0 11.4 29.5 54.9
France ............................................................................. 38.8 1.7 1.9 42.4
Germany ......................................................................... 30.3 5.9 5.6 41.8
The Netherlands .............................................................. 21.4 0.2 4.2 25.8
At 31 December 2006
UK ................................................................................... 24.8 – 33.5 58.3
Germany ......................................................................... 23.7 18.9 2.0 44.6
US ................................................................................... 9.5 12.7 16.2 38.4
France ............................................................................. 22.1 2.4 6.1 30.6
The Netherlands .............................................................. 14.4 2.1 3.9 20.4
Italy ................................................................................. 4.7 12.5 1.4 18.6