HSBC 2008 Annual Report Download - page 372
Download and view the complete annual report
Please find page 372 of the 2008 HSBC annual report below. You can navigate through the pages in the report by either clicking on the pages listed below, or by using the keyword search tool below to find specific information within the annual report.-
 1
1 -
2
-
3
-
4
-
5
-
6
-
7
-
8
-
9
-
10
-
11
-
12
-
13
-
14
-
15
-
16
-
17
-
18
-
19
-
20
-
21
-
22
-
23
-
24
-
25
-
26
-
27
-
28
-
29
-
30
-
31
-
32
-
33
-
34
-
35
-
36
-
37
-
38
-
39
-
40
-
41
-
42
-
43
-
44
-
45
-
46
-
47
-
48
-
49
-
50
-
51
-
52
-
53
-
54
-
55
-
56
-
57
-
58
-
59
-
60
-
61
-
62
-
63
-
64
-
65
-
66
-
67
-
68
-
69
-
70
-
71
-
72
-
73
-
74
-
75
-
76
-
77
-
78
-
79
-
80
-
81
-
82
-
83
-
84
-
85
-
86
-
87
-
88
-
89
-
90
-
91
-
92
-
93
-
94
-
95
-
96
-
97
-
98
-
99
-
100
-
101
-
102
-
103
-
104
-
105
-
106
-
107
-
108
-
109
-
110
-
111
-
112
-
113
-
114
-
115
-
116
-
117
-
118
-
119
-
120
-
121
-
122
-
123
-
124
-
125
-
126
-
127
-
128
-
129
-
130
-
131
-
132
-
133
-
134
-
135
-
136
-
137
-
138
-
139
-
140
-
141
-
142
-
143
-
144
-
145
-
146
-
147
-
148
-
149
-
150
-
151
-
152
-
153
-
154
-
155
-
156
-
157
-
158
-
159
-
160
-
161
-
162
-
163
-
164
-
165
-
166
-
167
-
168
-
169
-
170
-
171
-
172
-
173
-
174
-
175
-
176
-
177
-
178
-
179
-
180
-
181
-
182
-
183
-
184
-
185
-
186
-
187
-
188
-
189
-
190
-
191
-
192
-
193
-
194
-
195
-
196
-
197
-
198
-
199
-
200
-
201
-
202
-
203
-
204
-
205
-
206
-
207
-
208
-
209
-
210
-
211
-
212
-
213
-
214
-
215
-
216
-
217
-
218
-
219
-
220
-
221
-
222
-
223
-
224
-
225
-
226
-
227
-
228
-
229
-
230
-
231
-
232
-
233
-
234
-
235
-
236
-
237
-
238
-
239
-
240
-
241
-
242
-
243
-
244
-
245
-
246
-
247
-
248
-
249
-
250
-
251
-
252
-
253
-
254
-
255
-
256
-
257
-
258
-
259
-
260
-
261
-
262
-
263
-
264
-
265
-
266
-
267
-
268
-
269
-
270
-
271
-
272
-
273
-
274
-
275
-
276
-
277
-
278
-
279
-
280
-
281
-
282
-
283
-
284
-
285
-
286
-
287
-
288
-
289
-
290
-
291
-
292
-
293
-
294
-
295
-
296
-
297
-
298
-
299
-
300
-
301
-
302
-
303
-
304
-
305
-
306
-
307
-
308
-
309
-
310
-
311
-
312
-
313
-
314
-
315
-
316
-
317
-
318
-
319
-
320
-
321
-
322
-
323
-
324
-
325
-
326
-
327
-
328
-
329
-
330
-
331
-
332
-
333
-
334
-
335
-
336
-
337
-
338
-
339
-
340
-
341
-
342
-
343
-
344
-
345
-
346
-
347
-
348
-
349
-
350
-
351
-
352
-
353
-
354
-
355
-
356
-
357
-
358
-
359
-
360
-
361
-
 362
362 -
 363
363 -
 364
364 -
 365
365 -
 366
366 -
 367
367 -
 368
368 -
 369
369 -
 370
370 -
 371
371 -
 372
372 -
 373
373 -
 374
374 -
 375
375 -
 376
376 -
 377
377 -
 378
378 -
 379
379 -
 380
380 -
 381
381 -
 382
382 -
383
-
384
-
385
-
386
-
387
-
388
-
389
-
390
-
391
-
392
-
393
-
394
-
395
-
396
-
397
-
398
-
399
-
400
-
401
-
402
-
403
-
404
-
405
-
406
-
407
-
408
-
409
-
410
-
411
-
412
-
413
-
414
-
415
-
416
-
417
-
418
-
419
-
420
-
421
-
422
-
423
-
424
-
425
-
426
-
427
-
428
-
429
-
430
-
431
-
432
-
433
-
434
-
435
-
436
-
437
-
438
-
439
-
440
-
441
-
442
-
443
-
444
-
445
-
446
-
447
-
448
-
449
-
450
-
451
-
452
-
453
-
454
-
455
-
456
-
457
-
458
-
459
-
460
-
461
-
462
-
463
-
464
-
465
-
466
-
467
-
468
-
469
-
470
-
471
-
472
 |
 |

HSBC HOLDINGS PLC
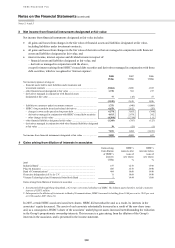
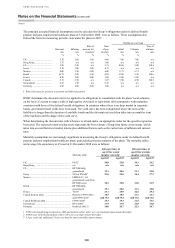
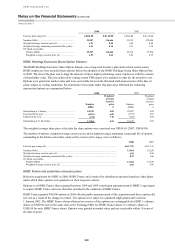
Notes on the Financial Statements (continued)
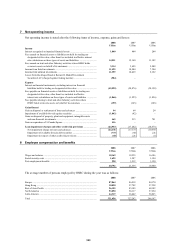
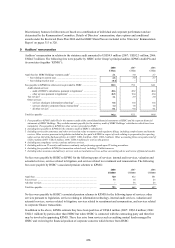
Note 8
370
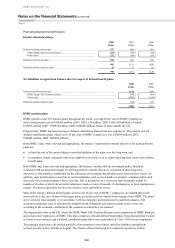
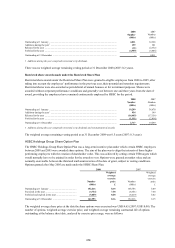
The following table shows the effect of changes in the discount rate and in mortality rates on plans other than the
principal plan:
Other plans
2008 2007
US$m US$m
Change in defined benefit obligation at year end from a 25bps increase in discount rate ............... (255) (312)
Change in 2009 defined benefit charge from a 25bps increase in discount rate .............................. (4) (8)
Increase in defined benefit obligation from each additional year of longevity assumed ................. 91 137
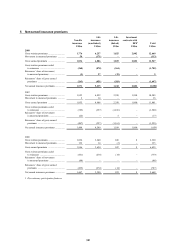
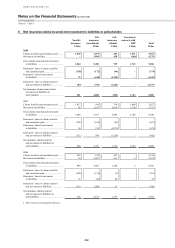
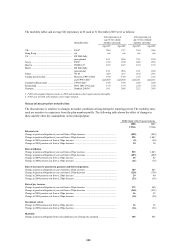
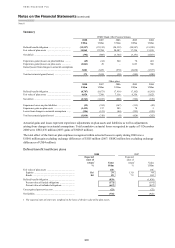
Defined benefit pension plans
The calculation of the net liability under the Group’s defined benefit pension plans is set out below together with the
expected rates of return and plan assets used to measure the net defined benefit pension costs in each subsequent year.
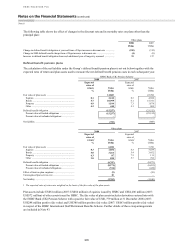
HSBC Bank (UK) Pension Scheme
2008 2007
Expected
rates of
return
Value
Expected
rates of
return Value
% US$m % US$m
Fair value of plan assets ............................................... 14,865
22,704
Equities ..................................................................... 8.1 2,242 8.3 4,580
Bonds ........................................................................ 5.7 10,999 6.1 15,341
Property .................................................................... 6.9 1,184 7.3 1,878
Other ......................................................................... 4.2 440 5.1 905
Defined benefit obligation ............................................ (15,257) (23,512)
Present value of funded obligations ......................... (15,257) (23,512)
Present value of unfunded obligations ..................... –
–
Net liability ................................................................... (392) (808)
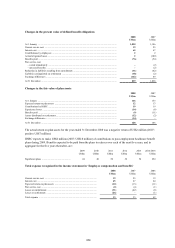
Other plans
2008 2007
Expected
rates of
return1
Value
Expected
rates of
return1 Value
% US$m
% US$m
Fair value of plan assets ............................................... 6,024
7,768
Equities ..................................................................... 8.3 1,856 8.3 3,439
Bonds ........................................................................ 5.0 3,261 5.4 3,452
Property .................................................................... 6.3 87 7.3 111
Other ......................................................................... 3.8 820 5.7 766
Defined benefit obligation ............................................ (8,787) (8,873)
Present value of funded obligations ......................... (8,271) (8,453)
Present value of unfunded obligations ..................... (516) (420)
Effect of limit on plan surpluses ................................... (9) (55)
Unrecognised past service cost ..................................... 10
–
Net liability ................................................................... (2,762) (1,160)
1 The expected rates of return are weighted on the basis of the fair value of the plan assets.
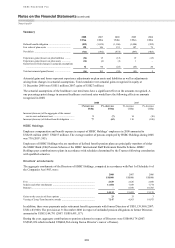
Plan assets include US$52 million (2007: US$86 million) of equities issued by HSBC and US$2,206 million (2007:
US$572 million) of other assets issued by HSBC. The fair value of plan assets includes derivatives entered into with
the HSBC Bank (UK) Pension Scheme with a positive fair value of US$1,779 million at 31 December 2008 (2007:
US$248 million positive fair value) and US$388 million positive fair value (2007: US$63 million positive fair value)
in respect of the HSBC International Staff Retirement Benefits Scheme. Further details of these swap arrangements
are included in Note 43.