HSBC 2008 Annual Report Download - page 6
Download and view the complete annual report
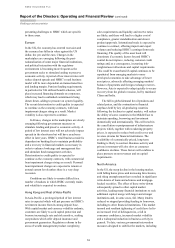
Please find page 6 of the 2008 HSBC annual report below. You can navigate through the pages in the report by either clicking on the pages listed below, or by using the keyword search tool below to find specific information within the annual report.-
 1
1 -
 2
2 -
 3
3 -
 4
4 -
 5
5 -
 6
6 -
 7
7 -
 8
8 -
 9
9 -
 10
10 -
 11
11 -
 12
12 -
 13
13 -
 14
14 -
 15
15 -
 16
16 -
 17
17 -
18
-
19
-
20
-
21
-
22
-
23
-
24
-
25
-
26
-
27
-
28
-
29
-
30
-
31
-
32
-
33
-
34
-
35
-
36
-
37
-
38
-
39
-
40
-
41
-
42
-
43
-
44
-
45
-
46
-
47
-
48
-
49
-
50
-
51
-
52
-
53
-
54
-
55
-
56
-
57
-
58
-
59
-
60
-
61
-
62
-
63
-
64
-
65
-
66
-
67
-
68
-
69
-
70
-
71
-
72
-
73
-
74
-
75
-
76
-
77
-
78
-
79
-
80
-
81
-
82
-
83
-
84
-
85
-
86
-
87
-
88
-
89
-
90
-
91
-
92
-
93
-
94
-
95
-
96
-
97
-
98
-
99
-
100
-
101
-
102
-
103
-
104
-
105
-
106
-
107
-
108
-
109
-
110
-
111
-
112
-
113
-
114
-
115
-
116
-
117
-
118
-
119
-
120
-
121
-
122
-
123
-
124
-
125
-
126
-
127
-
128
-
129
-
130
-
131
-
132
-
133
-
134
-
135
-
136
-
137
-
138
-
139
-
140
-
141
-
142
-
143
-
144
-
145
-
146
-
147
-
148
-
149
-
150
-
151
-
152
-
153
-
154
-
155
-
156
-
157
-
158
-
159
-
160
-
161
-
162
-
163
-
164
-
165
-
166
-
167
-
168
-
169
-
170
-
171
-
172
-
173
-
174
-
175
-
176
-
177
-
178
-
179
-
180
-
181
-
182
-
183
-
184
-
185
-
186
-
187
-
188
-
189
-
190
-
191
-
192
-
193
-
194
-
195
-
196
-
197
-
198
-
199
-
200
-
201
-
202
-
203
-
204
-
205
-
206
-
207
-
208
-
209
-
210
-
211
-
212
-
213
-
214
-
215
-
216
-
217
-
218
-
219
-
220
-
221
-
222
-
223
-
224
-
225
-
226
-
227
-
228
-
229
-
230
-
231
-
232
-
233
-
234
-
235
-
236
-
237
-
238
-
239
-
240
-
241
-
242
-
243
-
244
-
245
-
246
-
247
-
248
-
249
-
250
-
251
-
252
-
253
-
254
-
255
-
256
-
257
-
258
-
259
-
260
-
261
-
262
-
263
-
264
-
265
-
266
-
267
-
268
-
269
-
270
-
271
-
272
-
273
-
274
-
275
-
276
-
277
-
278
-
279
-
280
-
281
-
282
-
283
-
284
-
285
-
286
-
287
-
288
-
289
-
290
-
291
-
292
-
293
-
294
-
295
-
296
-
297
-
298
-
299
-
300
-
301
-
302
-
303
-
304
-
305
-
306
-
307
-
308
-
309
-
310
-
311
-
312
-
313
-
314
-
315
-
316
-
317
-
318
-
319
-
320
-
321
-
322
-
323
-
324
-
325
-
326
-
327
-
328
-
329
-
330
-
331
-
332
-
333
-
334
-
335
-
336
-
337
-
338
-
339
-
340
-
341
-
342
-
343
-
344
-
345
-
346
-
347
-
348
-
349
-
350
-
351
-
352
-
353
-
354
-
355
-
356
-
357
-
358
-
359
-
360
-
361
-
362
-
363
-
364
-
365
-
366
-
367
-
368
-
369
-
370
-
371
-
372
-
373
-
374
-
375
-
376
-
377
-
378
-
379
-
380
-
381
-
382
-
383
-
384
-
385
-
386
-
387
-
388
-
389
-
390
-
391
-
392
-
393
-
394
-
395
-
396
-
397
-
398
-
399
-
400
-
401
-
402
-
403
-
404
-
405
-
406
-
407
-
408
-
409
-
410
-
411
-
412
-
413
-
414
-
415
-
416
-
417
-
418
-
419
-
420
-
421
-
422
-
423
-
424
-
425
-
426
-
427
-
428
-
429
-
430
-
431
-
432
-
433
-
434
-
435
-
436
-
437
-
438
-
439
-
440
-
441
-
442
-
443
-
444
-
445
-
446
-
447
-
448
-
449
-
450
-
451
-
452
-
453
-
454
-
455
-
456
-
457
-
458
-
459
-
460
-
461
-
462
-
463
-
464
-
465
-
466
-
467
-
468
-
469
-
470
-
471
-
472
 |
 |

HSBC HOLDINGS PLC
Financial Highlights (continued)
5-year comparison
4
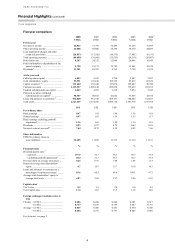
Five-year comparison
2008 2007 2006 2005 200412
US$m US$m US$m US$m US$m
For the year
Net interest income ................................... 42,563 37,795 34,486 31,334 31,099
Other operating income ............................ 46,008 49,806 35,584 30,370 24,889
Loan impairment charges and other
credit risk provisions ............................ (24,937) (17,242) (10,573) (7,801) (6,191)
Total operating expenses .......................... (49,099) (39,042) (33,553) (29,514) (26,487)
Profit before tax ........................................ 9,307 24,212 22,086 20,966 18,943
Profit attributable to shareholders of the
parent company .................................... 5,728 19,133 15,789 15,081 12,918
Dividends2 ................................................. 11,301 10,241 8,769 7,750 6,932
At the year-end
Called up share capital .............................. 6,053 5,915 5,786 5,667 5,587
Total shareholders’ equity ........................ 93,591 128,160 108,352 92,432 85,522
Capital resources1,13 .................................. 131,460 152,640 127,074 105,449 90,780
Customer accounts .................................... 1,115,327 1,096,140 896,834 739,419 693,072
Undated subordinated loan capital ........... 2,843 2,922 3,219 3,474 3,686
Preferred securities and dated
subordinated loan capital14 ................... 50,307 49,472 42,642 35,856 32,914
Loans and advances to customers15 ..........
932,868 981,548 868,133 740,002 672,891
Total assets ................................................ 2,527,465 2,354,266 1,860,758 1,501,970 1,279,974
US$ US$ US$ US$ US$
Per ordinary share
Basic earnings ........................................... 0.47 1.65 1.40 1.36 1.18
Diluted earnings ........................................ 0.47 1.63 1.39 1.35 1.17
Basic earnings excluding goodwill
impairment6 .......................................... 1.36 1.65 1.40 1.36 1.18
Dividends .................................................. 0.93 0.87 0.76 0.69 0.63
Net asset value at year-end16 .................... 7.44 10.72 9.24 8.03 7.66
Share information
US$0.50 ordinary shares in
issue (millions) ...................................... 12,105 11,829 11,572 11,334 11,172
% % % % %
Financial ratios
Dividend payout ratio17
– reported .................................................
.
197.9 52.7 54.3 50.7 53.4
– excluding goodwill impairment6 ..........
.
68.4 52.7 54.3 50.7 53.4
Post-tax return on average total assets ..... 0.26 0.97 1.00
1.06
1.14
Return on average total shareholders’
equity .................................................... 4.7 15.9 15.7
16.8
16.3
Loans and advances to customers as a
percentage of customer accounts ......... 83.6 89.5 96.8
100.1
97.1
Average total shareholders’ equity to
average total assets ............................... 4.87 5.69 5.97
5.96
6.35
Capital ratios1
Tier 1 ratio ................................................ 8.3 9.3 9.4 9.0 8.9
Total capital ratio ...................................... 11.4 13.6 13.5 12.8 12.0
Foreign exchange translation rates to
US$
Closing – £:US$1 ..................................... 0.686 0.498 0.509 0.581 0.517
– €:US$1 ..................................... 0.717 0.679 0.759 0.847 0.733
Average – £:US$1 ..................................... 0.545 0.500 0.543 0.550 0.546
– €:US$1 ..................................... 0.684 0.731 0.797 0.805 0.805
For footnotes, see page 5.