HSBC 2008 Annual Report Download - page 387
Download and view the complete annual report
Please find page 387 of the 2008 HSBC annual report below. You can navigate through the pages in the report by either clicking on the pages listed below, or by using the keyword search tool below to find specific information within the annual report.-
 1
1 -
2
-
3
-
4
-
5
-
6
-
7
-
8
-
9
-
10
-
11
-
12
-
13
-
14
-
15
-
16
-
17
-
18
-
19
-
20
-
21
-
22
-
23
-
24
-
25
-
26
-
27
-
28
-
29
-
30
-
31
-
32
-
33
-
34
-
35
-
36
-
37
-
38
-
39
-
40
-
41
-
42
-
43
-
44
-
45
-
46
-
47
-
48
-
49
-
50
-
51
-
52
-
53
-
54
-
55
-
56
-
57
-
58
-
59
-
60
-
61
-
62
-
63
-
64
-
65
-
66
-
67
-
68
-
69
-
70
-
71
-
72
-
73
-
74
-
75
-
76
-
77
-
78
-
79
-
80
-
81
-
82
-
83
-
84
-
85
-
86
-
87
-
88
-
89
-
90
-
91
-
92
-
93
-
94
-
95
-
96
-
97
-
98
-
99
-
100
-
101
-
102
-
103
-
104
-
105
-
106
-
107
-
108
-
109
-
110
-
111
-
112
-
113
-
114
-
115
-
116
-
117
-
118
-
119
-
120
-
121
-
122
-
123
-
124
-
125
-
126
-
127
-
128
-
129
-
130
-
131
-
132
-
133
-
134
-
135
-
136
-
137
-
138
-
139
-
140
-
141
-
142
-
143
-
144
-
145
-
146
-
147
-
148
-
149
-
150
-
151
-
152
-
153
-
154
-
155
-
156
-
157
-
158
-
159
-
160
-
161
-
162
-
163
-
164
-
165
-
166
-
167
-
168
-
169
-
170
-
171
-
172
-
173
-
174
-
175
-
176
-
177
-
178
-
179
-
180
-
181
-
182
-
183
-
184
-
185
-
186
-
187
-
188
-
189
-
190
-
191
-
192
-
193
-
194
-
195
-
196
-
197
-
198
-
199
-
200
-
201
-
202
-
203
-
204
-
205
-
206
-
207
-
208
-
209
-
210
-
211
-
212
-
213
-
214
-
215
-
216
-
217
-
218
-
219
-
220
-
221
-
222
-
223
-
224
-
225
-
226
-
227
-
228
-
229
-
230
-
231
-
232
-
233
-
234
-
235
-
236
-
237
-
238
-
239
-
240
-
241
-
242
-
243
-
244
-
245
-
246
-
247
-
248
-
249
-
250
-
251
-
252
-
253
-
254
-
255
-
256
-
257
-
258
-
259
-
260
-
261
-
262
-
263
-
264
-
265
-
266
-
267
-
268
-
269
-
270
-
271
-
272
-
273
-
274
-
275
-
276
-
277
-
278
-
279
-
280
-
281
-
282
-
283
-
284
-
285
-
286
-
287
-
288
-
289
-
290
-
291
-
292
-
293
-
294
-
295
-
296
-
297
-
298
-
299
-
300
-
301
-
302
-
303
-
304
-
305
-
306
-
307
-
308
-
309
-
310
-
311
-
312
-
313
-
314
-
315
-
316
-
317
-
318
-
319
-
320
-
321
-
322
-
323
-
324
-
325
-
326
-
327
-
328
-
329
-
330
-
331
-
332
-
333
-
334
-
335
-
336
-
337
-
338
-
339
-
340
-
341
-
342
-
343
-
344
-
345
-
346
-
347
-
348
-
349
-
350
-
351
-
352
-
353
-
354
-
355
-
356
-
357
-
358
-
359
-
360
-
361
-
362
-
363
-
364
-
365
-
366
-
367
-
368
-
369
-
370
-
371
-
372
-
373
-
374
-
375
-
376
-
 377
377 -
 378
378 -
 379
379 -
 380
380 -
 381
381 -
 382
382 -
 383
383 -
 384
384 -
 385
385 -
 386
386 -
 387
387 -
 388
388 -
 389
389 -
 390
390 -
 391
391 -
 392
392 -
 393
393 -
 394
394 -
 395
395 -
 396
396 -
 397
397 -
398
-
399
-
400
-
401
-
402
-
403
-
404
-
405
-
406
-
407
-
408
-
409
-
410
-
411
-
412
-
413
-
414
-
415
-
416
-
417
-
418
-
419
-
420
-
421
-
422
-
423
-
424
-
425
-
426
-
427
-
428
-
429
-
430
-
431
-
432
-
433
-
434
-
435
-
436
-
437
-
438
-
439
-
440
-
441
-
442
-
443
-
444
-
445
-
446
-
447
-
448
-
449
-
450
-
451
-
452
-
453
-
454
-
455
-
456
-
457
-
458
-
459
-
460
-
461
-
462
-
463
-
464
-
465
-
466
-
467
-
468
-
469
-
470
-
471
-
472
 |
 |

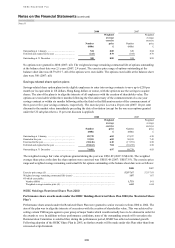
385
2008 2007 2006
US$m US$m US$m
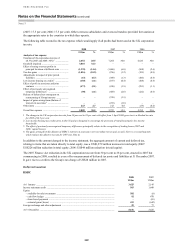
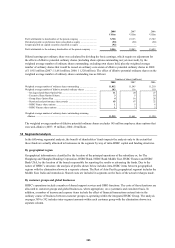
Profit attributable to shareholders of the parent company .............................. 5,728 19,133 15,789
Dividend payable on preference shares classified as equity ........................... (90) (90) (90)
Coupon payable on capital securities classified as equity .............................. (92) – –
Profit attributable to the ordinary shareholders of the parent company .......... 5,546 19,043 15,699
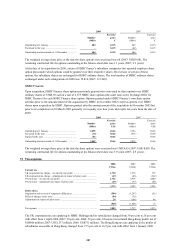
Diluted earnings per ordinary share was calculated by dividing the basic earnings, which require no adjustment for
the effects of dilutive potential ordinary shares (including share options outstanding not yet exercised), by the
weighted average number of ordinary shares outstanding, excluding own shares held, plus the weighted average
number of ordinary shares that would be issued on ordinary conversion of dilutive potential ordinary shares in 2008
of 11,915 million (2007: 11,661 million; 2006: 11,320 million). The effect of dilutive potential ordinary shares on the
weighted average number of ordinary shares outstanding was as follows:
Number of shares (millions)
2008 2007 2006
Weighted average number of ordinary shares outstanding ............................. 11,812 11,545 11,210
Weighted average number of dilutive potential ordinary shares .................... 103 116 110
– Savings-related Share Option Plan ........................................................... 11 20 27
– Executive Share Option Scheme .............................................................. 3 5 10
– Group Share Option Plan ......................................................................... 4 16 28
– Restricted and performance share awards ................................................ 83 67 32
– HSBC France share options ..................................................................... 1 5 8
– HSBC Finance share options ................................................................... 1 3 5
Weighted average number of ordinary shares outstanding assuming
dilution ......................................................................................................... 11,915 11,661 11,320
The weighted average number of dilutive potential ordinary shares excludes 145 million employee share options that
were anti-dilutive (2007: 19 million; 2006: 20 million).
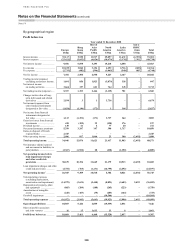
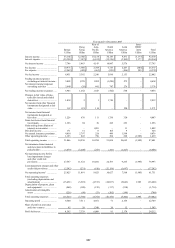
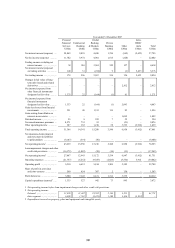
14 Segmental analysis
In the following segmental analysis, the benefit of shareholders’ funds impacts the analysis only to the extent that
these funds are actually allocated to businesses in the segment by way of intra-HSBC capital and funding structures.
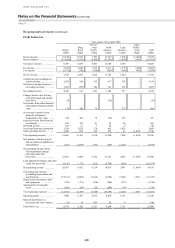
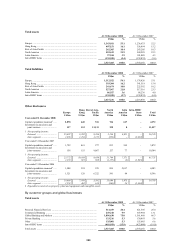
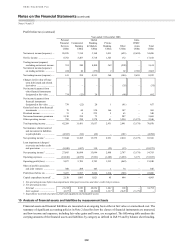
By geographical region
Geographical information is classified by the location of the principal operations of the subsidiary or, for The
Hongkong and Shanghai Banking Corporation, HSBC Bank, HSBC Bank Middle East, HSBC Finance and HSBC
Bank USA, by the location of the branch responsible for reporting the results or advancing the funds. Due to the
nature of HSBC’s structure, the analysis of profits shown below includes intra-HSBC items between geographical
regions with the elimination shown in a separate column. The Rest of Asia-Pacific geographical segment includes the
Middle East, India and Australasia. Shared costs are included in segments on the basis of the actual recharges made.
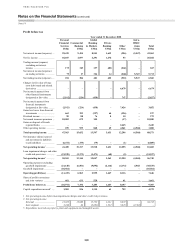
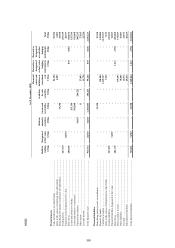
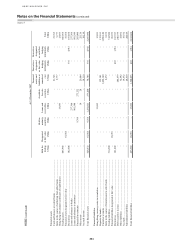
By customer groups and global businesses
HSBC’s operations include a number of shared support services and GMO functions. The costs of these functions are
allocated to customer groups and global businesses, where appropriate, on a systematic and consistent basis. In
addition, a number of income and expense items include the effect of financial transactions entered into in the
ordinary course of business between customer groups co-operating within the integrated HSBC Group. The analysis
on pages 389 to 392 includes inter-segment amounts within each customer group with the elimination shown in a
separate column.