GNC 2011 Annual Report Download - page 96
Download and view the complete annual report
Please find page 96 of the 2011 GNC annual report below. You can navigate through the pages in the report by either clicking on the pages listed below, or by using the keyword search tool below to find specific information within the annual report.-
 1
1 -
2
-
3
-
4
-
5
-
6
-
7
-
8
-
9
-
10
-
11
-
12
-
13
-
14
-
15
-
16
-
17
-
18
-
19
-
20
-
21
-
22
-
23
-
24
-
25
-
26
-
27
-
28
-
29
-
30
-
31
-
32
-
33
-
34
-
35
-
36
-
37
-
38
-
39
-
40
-
41
-
42
-
43
-
44
-
45
-
46
-
47
-
48
-
49
-
50
-
51
-
52
-
53
-
54
-
55
-
56
-
57
-
58
-
59
-
60
-
61
-
62
-
63
-
64
-
65
-
66
-
67
-
68
-
69
-
70
-
71
-
72
-
73
-
74
-
75
-
76
-
77
-
78
-
79
-
80
-
81
-
82
-
83
-
84
-
85
-
 86
86 -
 87
87 -
 88
88 -
 89
89 -
 90
90 -
 91
91 -
 92
92 -
 93
93 -
 94
94 -
 95
95 -
 96
96 -
 97
97 -
 98
98 -
 99
99 -
 100
100 -
 101
101 -
 102
102 -
 103
103 -
 104
104 -
 105
105 -
 106
106 -
107
-
108
-
109
-
110
-
111
-
112
-
113
-
114
-
115
-
116
-
117
-
118
-
119
-
120
-
121
-
122
-
123
-
124
-
125
-
126
-
127
-
128
-
129
-
130
-
131
-
132
-
133
-
134
-
135
-
136
-
137
-
138
-
139
-
140
-
141
-
142
-
143
-
144
-
145
-
146
-
147
-
148
-
149
-
150
-
151
-
152
-
153
-
154
-
155
-
156
-
157
-
158
-
159
-
160
-
161
-
162
-
163
-
164
-
165
-
166
-
167
-
168
-
169
-
170
-
171
-
172
-
173
-
174
-
175
-
176
-
177
-
178
-
179
-
180
-
181
-
182
-
183
-
184
-
185
-
186
-
187
-
188
-
189
-
190
-
191
-
192
-
193
-
194
-
195
-
196
-
197
-
198
-
199
-
200
-
201
-
202
-
203
-
204
-
205
 |
 |

Table of Contents
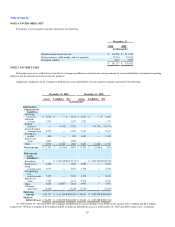
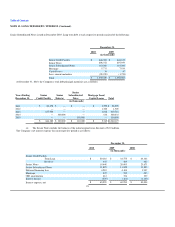
NOTE 7. GOODWILL, BRANDS, AND OTHER INTANGIBLE ASSETS, NET (Continued)
The following table represents the gross carrying amount and accumulated amortization for each major intangible asset:
December 31, 2010 December 31, 2009
Estimated
Life
in years
Cost Accumulated
Amortization Carrying
Amount Cost Accumulated
Amortization Carrying
Amount
(in thousands)
Brands —
retail — $500,000 $ — $ 500,000 $500,000 $ — $ 500,000
Brands —
franchise — 220,000 — 220,000 220,000 — 220,000
Gold card —
retail 3 3,500 (3,500) — 3,500 (3,354) 146
Gold card —
franchise 3 5,500 (5,500) — 5,500 (5,271) 229
Retail
agreements 25-35 31,000 (4,143) 26,857 31,000 (3,090) 27,910
Franchise
agreements 25 70,000 (10,617) 59,383 70,000 (7,817) 62,183
Manufacturing
agreements 25 70,000 (10,617) 59,383 70,000 (7,817) 62,183
Other
intangibles 5 1,150 (550) 600 1,150 (350) 800
Franchise
rights 1-5 3,702 (2,701) 1,001 3,061 (2,142) 919
$904,852 $ (37,628) $ 867,224 $904,211 $ (29,841) $ 874,370
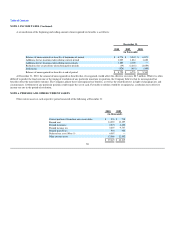
The following table represents future estimated amortization expense of intangible assets with finite lives:
Years ending December 31,
Estimated
amortization
expense
(in thousands)
2011 7,386
2012 7,105
2013 6,998
2014 6,710
2015 6,673
Thereafter 112,352
Total $ 147,224
90