GNC 2011 Annual Report Download - page 120
Download and view the complete annual report
Please find page 120 of the 2011 GNC annual report below. You can navigate through the pages in the report by either clicking on the pages listed below, or by using the keyword search tool below to find specific information within the annual report.-
 1
1 -
 2
2 -
 3
3 -
 4
4 -
 5
5 -
 6
6 -
 7
7 -
 8
8 -
 9
9 -
 10
10 -
 11
11 -
 12
12 -
 13
13 -
 14
14 -
 15
15 -
 16
16 -
 17
17 -
 18
18 -
 19
19 -
 20
20 -
 21
21 -
 22
22 -
 23
23 -
 24
24 -
 25
25 -
 26
26 -
 27
27 -
 28
28 -
 29
29 -
 30
30 -
 31
31 -
 32
32 -
 33
33 -
 34
34 -
 35
35 -
 36
36 -
 37
37 -
 38
38 -
 39
39 -
 40
40 -
 41
41 -
 42
42 -
 43
43 -
 44
44 -
 45
45 -
 46
46 -
 47
47 -
 48
48 -
 49
49 -
 50
50 -
 51
51 -
 52
52 -
 53
53 -
 54
54 -
 55
55 -
 56
56 -
 57
57 -
 58
58 -
 59
59 -
 60
60 -
 61
61 -
 62
62 -
 63
63 -
 64
64 -
 65
65 -
 66
66 -
 67
67 -
 68
68 -
 69
69 -
 70
70 -
 71
71 -
 72
72 -
 73
73 -
 74
74 -
 75
75 -
 76
76 -
 77
77 -
 78
78 -
 79
79 -
 80
80 -
 81
81 -
 82
82 -
 83
83 -
 84
84 -
 85
85 -
 86
86 -
 87
87 -
 88
88 -
 89
89 -
 90
90 -
 91
91 -
 92
92 -
 93
93 -
 94
94 -
 95
95 -
 96
96 -
 97
97 -
 98
98 -
 99
99 -
 100
100 -
 101
101 -
 102
102 -
 103
103 -
 104
104 -
 105
105 -
 106
106 -
 107
107 -
 108
108 -
 109
109 -
 110
110 -
 111
111 -
 112
112 -
 113
113 -
 114
114 -
 115
115 -
 116
116 -
 117
117 -
 118
118 -
 119
119 -
 120
120 -
 121
121 -
 122
122 -
 123
123 -
 124
124 -
 125
125 -
 126
126 -
 127
127 -
 128
128 -
 129
129 -
 130
130 -
 131
131 -
 132
132 -
 133
133 -
 134
134 -
 135
135 -
 136
136 -
 137
137 -
 138
138 -
 139
139 -
 140
140 -
 141
141 -
 142
142 -
 143
143 -
 144
144 -
 145
145 -
 146
146 -
 147
147 -
 148
148 -
 149
149 -
 150
150 -
 151
151 -
 152
152 -
 153
153 -
 154
154 -
 155
155 -
 156
156 -
 157
157 -
 158
158 -
 159
159 -
 160
160 -
 161
161 -
 162
162 -
 163
163 -
 164
164 -
 165
165 -
 166
166 -
 167
167 -
 168
168 -
 169
169 -
 170
170 -
 171
171 -
 172
172 -
 173
173 -
 174
174 -
 175
175 -
 176
176 -
 177
177 -
 178
178 -
 179
179 -
 180
180 -
 181
181 -
 182
182 -
 183
183 -
 184
184 -
 185
185 -
 186
186 -
 187
187 -
 188
188 -
 189
189 -
 190
190 -
 191
191 -
 192
192 -
 193
193 -
 194
194 -
 195
195 -
 196
196 -
 197
197 -
 198
198 -
 199
199 -
 200
200 -
 201
201 -
 202
202 -
 203
203 -
 204
204 -
 205
205
 |
 |

Table of Contents
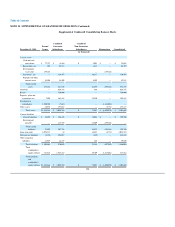
NOTE 25. SUPPLEMENTAL GUARANTOR INFORMATION (Continued)
Supplemental Condensed Consolidating Balance Sheets
December 31, 2009
Parent/
Issuer
Combined
Guarantor
Subsidiaries
Combined
Non-Guarantor
Subsidiaries Eliminations Consolidated
(in thousands)
Current assets
Cash and cash
equivalents $ 77,797 $ (4,801) $ 2,093 $ — $ 75,089
Receivables, net 895 92,273 1,187 — 94,355
Intercompany
receivables 139,168 — — (139,168) —
Inventories, net — 339,975 30,517 — 370,492
Prepaids and other
current assets 19,308 14,409 8,502 — 42,219
Total current
assets 237,168 441,856 42,299 (139,168) 582,155
Goodwill — 624,285 468 — 624,753
Brands — 720,000 — — 720,000
Property, plant and
equipment, net 7,409 163,882 28,290 — 199,581
Investment in
subsidiaries 1,550,708 (7,687) — (1,543,021) —
Other assets 28,876 157,018 — (8,781) 177,113
Total assets $1,824,161 $ 2,099,354 $ 71,057 $ (1,690,970) $ 2,303,602
Current liabilities
Current liabilities $ 33,892 $ 154,435 $ 11,023 $ — $ 199,350
Intercompany
payables — 113,359 25,809 (139,168) —
Total current
liabilities 33,892 267,794 36,832 (139,168) 199,350
Long-term debt 1,052,578 32 14,493 (8,781) 1,058,322
Deferred tax liabilities (4,754) 294,087 (439) — 288,894
Other long-term
liabilities 24,929 14,129 462 — 39,520
Total liabilities 1,106,645 576,042 51,348 (147,949) 1,586,086
Total
stockholder's
equity (deficit) 717,516 1,523,312 19,709 (1,543,021) 717,516
Total liabilities
and
stockholder's
equity (deficit) $1,824,161 $ 2,099,354 $ 71,057 $ (1,690,970) $ 2,303,602
114
