GNC 2011 Annual Report Download - page 110
Download and view the complete annual report
Please find page 110 of the 2011 GNC annual report below. You can navigate through the pages in the report by either clicking on the pages listed below, or by using the keyword search tool below to find specific information within the annual report.-
 1
1 -
2
-
3
-
4
-
5
-
6
-
7
-
8
-
9
-
10
-
11
-
12
-
13
-
14
-
15
-
16
-
17
-
18
-
19
-
20
-
21
-
22
-
23
-
24
-
25
-
26
-
27
-
28
-
29
-
30
-
31
-
32
-
33
-
34
-
35
-
36
-
37
-
38
-
39
-
40
-
41
-
42
-
43
-
44
-
45
-
46
-
47
-
48
-
49
-
50
-
51
-
52
-
53
-
54
-
55
-
56
-
57
-
58
-
59
-
60
-
61
-
62
-
63
-
64
-
65
-
66
-
67
-
68
-
69
-
70
-
71
-
72
-
73
-
74
-
75
-
76
-
77
-
78
-
79
-
80
-
81
-
82
-
83
-
84
-
85
-
86
-
87
-
88
-
89
-
90
-
91
-
92
-
93
-
94
-
95
-
96
-
97
-
98
-
99
-
 100
100 -
 101
101 -
 102
102 -
 103
103 -
 104
104 -
 105
105 -
 106
106 -
 107
107 -
 108
108 -
 109
109 -
 110
110 -
 111
111 -
 112
112 -
 113
113 -
 114
114 -
 115
115 -
 116
116 -
 117
117 -
 118
118 -
 119
119 -
 120
120 -
121
-
122
-
123
-
124
-
125
-
126
-
127
-
128
-
129
-
130
-
131
-
132
-
133
-
134
-
135
-
136
-
137
-
138
-
139
-
140
-
141
-
142
-
143
-
144
-
145
-
146
-
147
-
148
-
149
-
150
-
151
-
152
-
153
-
154
-
155
-
156
-
157
-
158
-
159
-
160
-
161
-
162
-
163
-
164
-
165
-
166
-
167
-
168
-
169
-
170
-
171
-
172
-
173
-
174
-
175
-
176
-
177
-
178
-
179
-
180
-
181
-
182
-
183
-
184
-
185
-
186
-
187
-
188
-
189
-
190
-
191
-
192
-
193
-
194
-
195
-
196
-
197
-
198
-
199
-
200
-
201
-
202
-
203
-
204
-
205
 |
 |

Table of Contents
NOTE 18. STOCK-BASED COMPENSATION PLANS (Continued)
The following table outlines Parent's total stock options activity:
Total Options
Weighted
Average
Exercise Price
Outstanding at December 31, 2009 9,263,640 $ 7.27
Granted 680,000 12.58
Exercised (13,876) 7.91
Forfeited (518,325) 8.19
Expired (67,251) 6.25
Outstanding at December 31, 2010 9,344,188 $ 7.60
Exercisable at December 31, 2010 5,031,731 $ 6.82
Stock-based compensation expense for the years ended December 31, 2010, 2009 and 2008 was $3.2 million, $2.9 million, and $2.6 million,
respectively.
As of December 31, 2010, the weighted average remaining contractual life of outstanding options was 6.6 years. At December 31, 2010, the weighted
average remaining contractual life of exercisable options was 6.1 years. The weighted average fair value of options granted during 2010, 2009 and 2008 was
$2.65, $3.19, and $1.17, respectively.
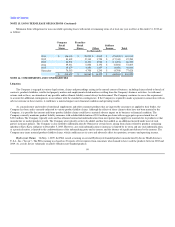
The Black Scholes model utilizes the following assumptions in determining a fair value: price of underlying stock, option exercise price, expected
option term, risk-free interest rate, expected dividend yield, and expected stock price volatility over the option's expected term. As the Company has had
minimal exercises of stock options through December 31, 2010, 2009 and 2008 option term has been estimated by considering both the vesting period, which
is typically for the successor and predecessor plans, five and four years, respectively, and the contractual term of ten and seven years, respectively. As the
Company's underlying stock is not publicly traded on an open market, the Company utilized its current peer group average to estimate the expected volatility.
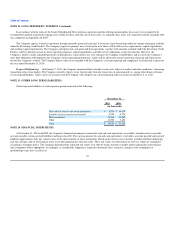
The assumptions used in the Company's Black Scholes valuation related to stock option grants made during the years ended December 31, 2010, 2009 and
2008 were as follows:
2010 2009 2008
Dividend yield 0.00% 0.00% 0.00%
Expected option life 7.5 years 7.5 years 7.5 years
Volatility factor percentage of market price 31.5% - 33.00% 34.20% - 44.60% 26.00% - 28.40%
Discount rate 2.49% - 3.28% 0.43% - 3.28% 3.08% - 3.64%
As the Black-Scholes option valuation model utilizes certain estimates and assumptions, the existing models do not necessarily represent the definitive
fair value of options for future periods. Assumptions used in the Black-Scholes option valuation model include the fair value of the stock, as the stock is not
publicly traded, and volatility. The fair value of the stock is estimated based upon the net enterprise value of the Company, discounted to reflect the lack of
liquidity and control associated with the stock. Volatility is estimated based upon the volatility in a sample peer group of companies. The average estimated
fair value of Holdings Class A common stock for the years ended December 31, 2010, 2009 and 2008 were $9.89, $5.95, and $5.17 per share, respectively.
104