GNC 2011 Annual Report Download - page 116
Download and view the complete annual report
Please find page 116 of the 2011 GNC annual report below. You can navigate through the pages in the report by either clicking on the pages listed below, or by using the keyword search tool below to find specific information within the annual report.-
 1
1 -
2
-
3
-
4
-
5
-
6
-
7
-
8
-
9
-
10
-
11
-
12
-
13
-
14
-
15
-
16
-
17
-
18
-
19
-
20
-
21
-
22
-
23
-
24
-
25
-
26
-
27
-
28
-
29
-
30
-
31
-
32
-
33
-
34
-
35
-
36
-
37
-
38
-
39
-
40
-
41
-
42
-
43
-
44
-
45
-
46
-
47
-
48
-
49
-
50
-
51
-
52
-
53
-
54
-
55
-
56
-
57
-
58
-
59
-
60
-
61
-
62
-
63
-
64
-
65
-
66
-
67
-
68
-
69
-
70
-
71
-
72
-
73
-
74
-
75
-
76
-
77
-
78
-
79
-
80
-
81
-
82
-
83
-
84
-
85
-
86
-
87
-
88
-
89
-
90
-
91
-
92
-
93
-
94
-
95
-
96
-
97
-
98
-
99
-
100
-
101
-
102
-
103
-
104
-
105
-
 106
106 -
 107
107 -
 108
108 -
 109
109 -
 110
110 -
 111
111 -
 112
112 -
 113
113 -
 114
114 -
 115
115 -
 116
116 -
 117
117 -
 118
118 -
 119
119 -
 120
120 -
 121
121 -
 122
122 -
 123
123 -
 124
124 -
 125
125 -
 126
126 -
127
-
128
-
129
-
130
-
131
-
132
-
133
-
134
-
135
-
136
-
137
-
138
-
139
-
140
-
141
-
142
-
143
-
144
-
145
-
146
-
147
-
148
-
149
-
150
-
151
-
152
-
153
-
154
-
155
-
156
-
157
-
158
-
159
-
160
-
161
-
162
-
163
-
164
-
165
-
166
-
167
-
168
-
169
-
170
-
171
-
172
-
173
-
174
-
175
-
176
-
177
-
178
-
179
-
180
-
181
-
182
-
183
-
184
-
185
-
186
-
187
-
188
-
189
-
190
-
191
-
192
-
193
-
194
-
195
-
196
-
197
-
198
-
199
-
200
-
201
-
202
-
203
-
204
-
205
 |
 |

Table of Contents
NOTE 22. RETIREMENT PLANS (Continued)
$0.6 million in February 2010, and for the 2010 plan year will make a cash payment of $0.9 million in March 2011.
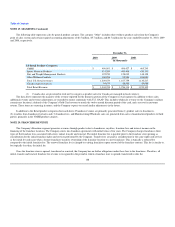
The Company has a Non-qualified Executive Retirement Arrangement Plan that covers key employees. Under the provisions of this plan, certain
eligible key employees are granted cash compensation, which in the aggregate was not significant for any year presented.
The Company has a Non-qualified Deferred Compensation Plan that provides benefits payable to certain qualified key employees upon their retirement
or their designated beneficiaries upon death. This plan allows participants the opportunity to defer pretax amounts ranging from 2% to 100% of their base
compensation plus bonuses. The plan is funded entirely by elective contributions made by the participants. The Company has elected to finance any potential
plan benefit obligations using corporate owned life insurance policies. All assets relating to the non-qualified deferred compensation plan are held in a rabbi
trust.
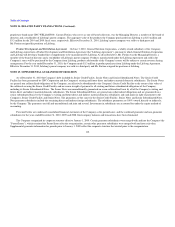
NOTE 23. FAIR VALUE MEASUREMENTS
As described in Note 2, "Basis of Presentation and Summary of Significant Accounting Policies", the Company adopted the provisions of the new
standard on fair value measurements and disclosures as of January 1, 2008. This standard defines fair value, establishes a consistent framework for measuring
fair value, and expands disclosures for each major asset and liability category measured at fair value on either a recurring or nonrecurring basis. The standard
clarifies that fair value is an exit price, representing the amount that would be received to sell an asset or paid to transfer a liability in an orderly transaction
between market participants. As such, fair value is a market-based measurement that should be determined based on assumptions that market participants
would use in pricing an asset or liability. As a basis for considering such assumptions, the standard establishes a three-tier fair value hierarchy which
prioritizes the inputs used in measuring fair value as follows:
Level 1 — observable inputs such as quoted prices in active markets for identical assets and liabilities;
Level 2
—
observable inputs such as quoted prices for similar assets or liabilities in active markets, quoted prices for identical
or similar assets or liabilities in markets that are not active, other inputs that are observable, or can be corroborated
by observable market data; and
Level 3
—
unobservable inputs for which there are little or no market data, which require the reporting entity to develop its
own assumptions.
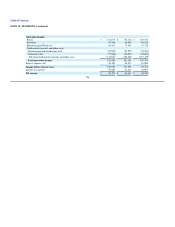
The following table presents the Company's financial assets and liabilities that were accounted for at fair value on a recurring basis as of December 31,
2010 by level within the fair value hierarchy:
Fair Value Measurements Using
Level 1 Level 2 Level 3
(in thousands)
Other current liabilities $ — $ 4,395 $ —
Other long-term liabilities $ 3,034 $ 3,074 $ —
110