GNC 2011 Annual Report Download - page 47
Download and view the complete annual report
Please find page 47 of the 2011 GNC annual report below. You can navigate through the pages in the report by either clicking on the pages listed below, or by using the keyword search tool below to find specific information within the annual report.-
 1
1 -
2
-
3
-
4
-
5
-
6
-
7
-
8
-
9
-
10
-
11
-
12
-
13
-
14
-
15
-
16
-
17
-
18
-
19
-
20
-
21
-
22
-
23
-
24
-
25
-
26
-
27
-
28
-
29
-
30
-
31
-
32
-
33
-
34
-
35
-
36
-
 37
37 -
 38
38 -
 39
39 -
 40
40 -
 41
41 -
 42
42 -
 43
43 -
 44
44 -
 45
45 -
 46
46 -
 47
47 -
 48
48 -
 49
49 -
 50
50 -
 51
51 -
 52
52 -
 53
53 -
 54
54 -
 55
55 -
 56
56 -
 57
57 -
58
-
59
-
60
-
61
-
62
-
63
-
64
-
65
-
66
-
67
-
68
-
69
-
70
-
71
-
72
-
73
-
74
-
75
-
76
-
77
-
78
-
79
-
80
-
81
-
82
-
83
-
84
-
85
-
86
-
87
-
88
-
89
-
90
-
91
-
92
-
93
-
94
-
95
-
96
-
97
-
98
-
99
-
100
-
101
-
102
-
103
-
104
-
105
-
106
-
107
-
108
-
109
-
110
-
111
-
112
-
113
-
114
-
115
-
116
-
117
-
118
-
119
-
120
-
121
-
122
-
123
-
124
-
125
-
126
-
127
-
128
-
129
-
130
-
131
-
132
-
133
-
134
-
135
-
136
-
137
-
138
-
139
-
140
-
141
-
142
-
143
-
144
-
145
-
146
-
147
-
148
-
149
-
150
-
151
-
152
-
153
-
154
-
155
-
156
-
157
-
158
-
159
-
160
-
161
-
162
-
163
-
164
-
165
-
166
-
167
-
168
-
169
-
170
-
171
-
172
-
173
-
174
-
175
-
176
-
177
-
178
-
179
-
180
-
181
-
182
-
183
-
184
-
185
-
186
-
187
-
188
-
189
-
190
-
191
-
192
-
193
-
194
-
195
-
196
-
197
-
198
-
199
-
200
-
201
-
202
-
203
-
204
-
205
 |
 |
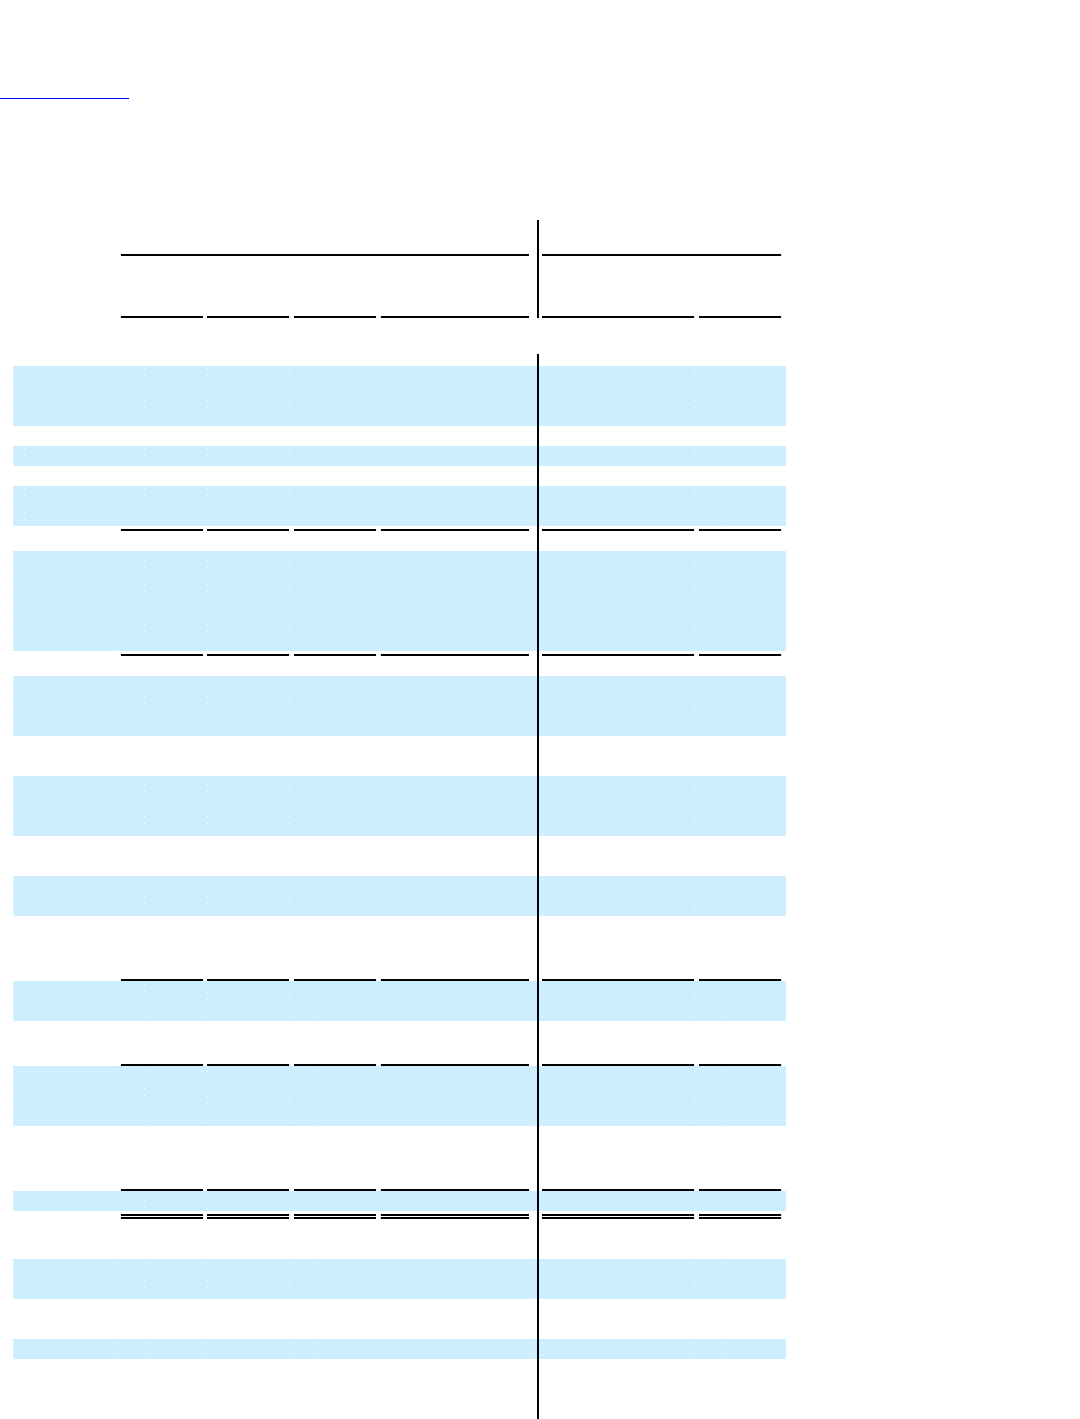
Table of Contents
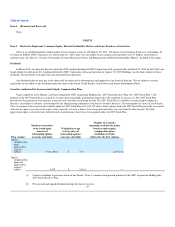
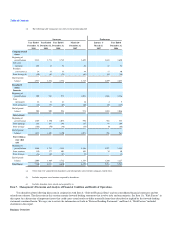
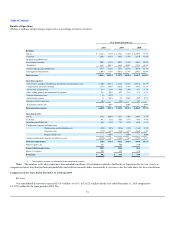
You should read the following financial information together with the information under Item 7, "Management's Discussion and Analysis of Financial
Condition and Results of Operations" and our consolidated financial statements and their related notes.
Successor
Predecessor
Year Ended
December 31,
2010
Year Ended
December 31,
2009
Year Ended
December 31,
2008
March 16-
December 31,
2007
January 1-
March 15,
2007
Year Ended
December 31,
2006
(dollars in millions)
Statement of
Operations
Data:
Revenue
Retail $ 1,344.4 $ 1,256.3 $ 1,219.3 $ 909.3 $ 259.3 $ 1,122.7
Franchising 293.8 264.2 258.0 193.9 47.2 232.3
Manufacturing/
Wholesale 184.2 186.5 179.4 119.8 23.3 132.1
Total revenue 1,822.4 1,707.0 1,656.7 1,223.0 329.8 1,487.1
Cost of sales,
including costs
of warehousing
distribution
and occupancy 1,180.0 1,116.4 1,082.6 814.2 212.2 983.5
Gross profit 642.4 590.6 574.1 408.8 117.6 503.6
Compensation
and related
benefits 273.6 263.0 249.8 195.8 64.3 260.8
Advertising and
promotion 51.4 50.0 55.1 35.0 20.5 50.7
Other selling,
general and
administrative 99.6 96.5 98.7 71.3 17.3 92.4
Other (income)
expense(1) (0.3) (0.1) 0.7 (0.4) (0.1) 0.5
Merger related
costs — — — — 34.6 —
Strategic
alternative
costs 3.5 — — — — —
Operating income
(loss) 214.6 181.2 169.8 107.1 (19.0) 99.2
Interest expense,
net 65.5 70.0 83.0 75.5 43.0 39.6
Income (loss)
before income
taxes 149.1 111.2 86.8 31.6 (62.0) 59.6
Income tax
expense
(benefit) 50.9 41.6 32.0 12.6 (10.7) 22.2
Net income (loss) $ 98.2 $ 69.6 $ 54.8 $ 19.0 $ (51.3) $ 37.4
Balance Sheet
Data:
Cash and cash
equivalents $ 150.6 $ 75.1 $ 42.3 $ 28.9 $ 24.1
Working
capital(2) 443.0 382.6 305.1 258.1 249.5
Total assets 2,382.5 2,303.6 2,292.0 2,239.6 968.8
Total current and
non-current
long-term debt 1,058.5 1,059.8 1,084.7 1,087.0 431.4