GNC 2011 Annual Report Download - page 122
Download and view the complete annual report
Please find page 122 of the 2011 GNC annual report below. You can navigate through the pages in the report by either clicking on the pages listed below, or by using the keyword search tool below to find specific information within the annual report.-
 1
1 -
2
-
3
-
4
-
5
-
6
-
7
-
8
-
9
-
10
-
11
-
12
-
13
-
14
-
15
-
16
-
17
-
18
-
19
-
20
-
21
-
22
-
23
-
24
-
25
-
26
-
27
-
28
-
29
-
30
-
31
-
32
-
33
-
34
-
35
-
36
-
37
-
38
-
39
-
40
-
41
-
42
-
43
-
44
-
45
-
46
-
47
-
48
-
49
-
50
-
51
-
52
-
53
-
54
-
55
-
56
-
57
-
58
-
59
-
60
-
61
-
62
-
63
-
64
-
65
-
66
-
67
-
68
-
69
-
70
-
71
-
72
-
73
-
74
-
75
-
76
-
77
-
78
-
79
-
80
-
81
-
82
-
83
-
84
-
85
-
86
-
87
-
88
-
89
-
90
-
91
-
92
-
93
-
94
-
95
-
96
-
97
-
98
-
99
-
100
-
101
-
102
-
103
-
104
-
105
-
106
-
107
-
108
-
109
-
110
-
111
-
 112
112 -
 113
113 -
 114
114 -
 115
115 -
 116
116 -
 117
117 -
 118
118 -
 119
119 -
 120
120 -
 121
121 -
 122
122 -
 123
123 -
 124
124 -
 125
125 -
 126
126 -
 127
127 -
 128
128 -
 129
129 -
 130
130 -
 131
131 -
 132
132 -
133
-
134
-
135
-
136
-
137
-
138
-
139
-
140
-
141
-
142
-
143
-
144
-
145
-
146
-
147
-
148
-
149
-
150
-
151
-
152
-
153
-
154
-
155
-
156
-
157
-
158
-
159
-
160
-
161
-
162
-
163
-
164
-
165
-
166
-
167
-
168
-
169
-
170
-
171
-
172
-
173
-
174
-
175
-
176
-
177
-
178
-
179
-
180
-
181
-
182
-
183
-
184
-
185
-
186
-
187
-
188
-
189
-
190
-
191
-
192
-
193
-
194
-
195
-
196
-
197
-
198
-
199
-
200
-
201
-
202
-
203
-
204
-
205
 |
 |

Table of Contents
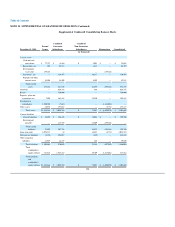
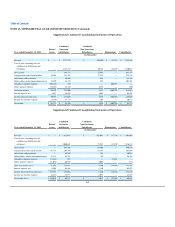
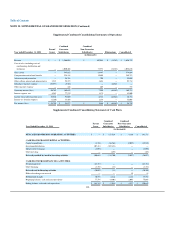
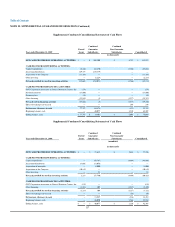
NOTE 25. SUPPLEMENTAL GUARANTOR INFORMATION (Continued)
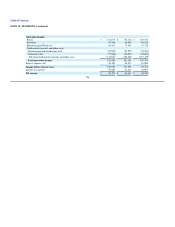
Supplemental Condensed Consolidating Statements of Operations
Year ended December 31, 2008
Parent/
Issuer
Combined
Guarantor
Subsidiaries
Combined
Non-Guarantor
Subsidiaries Eliminations Consolidated
(in thousands)
Revenue $ — $ 1,566,054 $ 102,018 $ (11,343) $ 1,656,729
Cost of sales, including costs of
warehousing, distribution and
occupancy — 1,020,402 73,571 (11,343) 1,082,630
Gross profit — 545,652 28,447 — 574,099
Compensation and related benefits — 234,188 15,605 — 249,793
Advertising and promotion — 54,351 709 — 55,060
Other selling, general and administrative 2,215 92,893 3,624 — 98,732
Subsidiary (income) expense (58,977) (5,565) — 64,542 —
Other (income) expense — 126 607 — 733
Operating income (loss) 56,762 169,659 7,902 (64,542) 169,781
Interest expense, net 4,242 77,579 1,179 — 83,000
Income (loss) before income taxes 52,520 92,080 6,723 (64,542) 86,781
Income tax (benefit) expense (2,260) 33,103 1,158 — 32,001
Net income (loss) $ 54,780 $ 58,977 $ 5,565 $ (64,542) $ 54,780
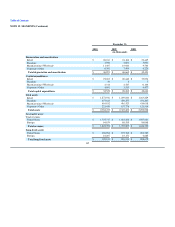
Supplemental Condensed Consolidating Statements of Cash Flows
Year Ended December 31, 2010
Parent/
Issuer
Combined
Guarantor
Subsidiaries
Combined
Non-Guarantor
Subsidiaries Consolidated
(in thousands)
NET CASH PROVIDED BY OPERATING ACTIVITIES: $ — $ 137,529 $ 4,186 $ 141,715
CASH FLOWS FROM INVESTING ACTIVITIES:
Capital expenditures (3,701) (26,764) (2,057) (32,522)
Investment/distribution 107,481 (107,481) — —
Merger of the Company (3,096) — — (3,096)
Other investing — (455) — (455)
Net cash provided by (used in) investing activities 100,684 (134,700) (2,057) (36,073)
CASH FLOWS FROM FINANCING ACTIVITIES:
Dividend payment (28,384) — — (28,384)
Other financing (1,708) (13) — (1,721)
Net cash used in financing activities (30,092) (13) — (30,105)
Effect of exchange rate on cash — — 15 15
Net increase in cash 70,592 2,816 2,144 75,552
Beginning balance, cash and cash equivalents 77,797 (4,801) 2,093 75,089
Ending balance, cash and cash equivalents $ 148,389 $ (1,985) $ 4,237 $ 150,641
116