GNC 2011 Annual Report Download - page 51
Download and view the complete annual report
Please find page 51 of the 2011 GNC annual report below. You can navigate through the pages in the report by either clicking on the pages listed below, or by using the keyword search tool below to find specific information within the annual report.-
 1
1 -
2
-
3
-
4
-
5
-
6
-
7
-
8
-
9
-
10
-
11
-
12
-
13
-
14
-
15
-
16
-
17
-
18
-
19
-
20
-
21
-
22
-
23
-
24
-
25
-
26
-
27
-
28
-
29
-
30
-
31
-
32
-
33
-
34
-
35
-
36
-
37
-
38
-
39
-
40
-
 41
41 -
 42
42 -
 43
43 -
 44
44 -
 45
45 -
 46
46 -
 47
47 -
 48
48 -
 49
49 -
 50
50 -
 51
51 -
 52
52 -
 53
53 -
 54
54 -
 55
55 -
 56
56 -
 57
57 -
 58
58 -
 59
59 -
 60
60 -
 61
61 -
62
-
63
-
64
-
65
-
66
-
67
-
68
-
69
-
70
-
71
-
72
-
73
-
74
-
75
-
76
-
77
-
78
-
79
-
80
-
81
-
82
-
83
-
84
-
85
-
86
-
87
-
88
-
89
-
90
-
91
-
92
-
93
-
94
-
95
-
96
-
97
-
98
-
99
-
100
-
101
-
102
-
103
-
104
-
105
-
106
-
107
-
108
-
109
-
110
-
111
-
112
-
113
-
114
-
115
-
116
-
117
-
118
-
119
-
120
-
121
-
122
-
123
-
124
-
125
-
126
-
127
-
128
-
129
-
130
-
131
-
132
-
133
-
134
-
135
-
136
-
137
-
138
-
139
-
140
-
141
-
142
-
143
-
144
-
145
-
146
-
147
-
148
-
149
-
150
-
151
-
152
-
153
-
154
-
155
-
156
-
157
-
158
-
159
-
160
-
161
-
162
-
163
-
164
-
165
-
166
-
167
-
168
-
169
-
170
-
171
-
172
-
173
-
174
-
175
-
176
-
177
-
178
-
179
-
180
-
181
-
182
-
183
-
184
-
185
-
186
-
187
-
188
-
189
-
190
-
191
-
192
-
193
-
194
-
195
-
196
-
197
-
198
-
199
-
200
-
201
-
202
-
203
-
204
-
205
 |
 |

Table of Contents
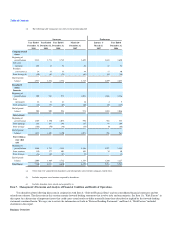
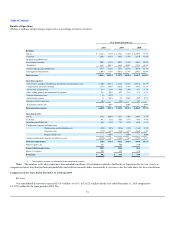
Revenues and Operating Performance from our Segments
We measure our operating performance primarily through revenues and operating income from our three segments, Retail, Franchise, and
Manufacturing/Wholesale, and through the management of unallocated costs from our warehousing, distribution and corporate segments, as follows:
Retail: Retail revenues are generated by sales to consumers at our company-owned stores and online through GNC.com. Although we believe
that our retail and franchise businesses are not seasonal in nature, historically we have experienced, and expect to continue to experience, a
variation in our net sales and operating results from quarter to quarter, with the first half of the year being stronger than the second half of the
year. According to Nutrition Business Journal's Supplement Business Report 2010, our industry is expected to grow at an annual average rate of
approximately 5.3% through 2015. As a leader in our industry, we expect our organic retail revenue growth to be consistent with projected
industry growth as a result of our disproportionate market share, scale economies in purchasing and advertising, strong brand awareness and
vertical integration.
Franchise: Franchise revenues are generated primarily from:
product sales to our franchisees;
royalties on franchise retail sales; and
franchise fees, which are charged for initial franchise awards, renewals, and transfers of franchises.
As described above, our industry is expected to grow at an annual average rate of approximately 5.3% through 2015. Although we do not anticipate the
number of our domestic franchise stores to grow substantially, we expect to achieve domestic franchise store revenue growth consistent with projected
industry growth, which will be generated by royalties on franchise retail sales and product sales to our existing franchisees. As a result of our efforts to expand
our international presence and provisions in our international franchising agreements requiring franchisees to open additional stores, we have increased our
international store base in recent periods and expect to continue to increase the number of our international franchise stores over the next five years. We
believe this will result in additional franchise fees associated with new store openings and increased revenues from product sales to, and royalties from, new
franchisees. As our existing international franchisees continue to open additional stores, we also anticipate that franchise revenue from international
operations will be driven by increased product sales to, and royalties from, our franchisees. Since our international franchisees pay royalties to us in U.S.
dollars, any strengthening of the U.S. dollar relative to our franchisees' local currency may offset some of the growth in royalty revenue.
Manufacturing/Wholesale: Manufacturing/Wholesale revenues are generated through sales of manufactured products to third parties, generally
for third-party private label brands, and the sale of our proprietary and third-party products to and through Rite Aid and www.drugstore.com, and
the sale of our proprietary products to and through PetSmart. License fee revenue from the opening of GNC franchise store-within-a-store
locations within Rite Aid stores is also recorded in this segment. Our revenues generated by our manufacturing and wholesale operations are
subject to our available manufacturing capacity.
A significant portion of our business infrastructure is comprised of fixed operating costs. Our vertically-integrated distribution network and
manufacturing capacity can support higher sales volume without significant incremental costs. We therefore expect our operating expenses to grow at a lesser
rate than our revenues, resulting in positive operating leverage.
47
•
•
(1)
(2)
(3)
•