GNC 2011 Annual Report Download - page 62
Download and view the complete annual report
Please find page 62 of the 2011 GNC annual report below. You can navigate through the pages in the report by either clicking on the pages listed below, or by using the keyword search tool below to find specific information within the annual report.-
 1
1 -
2
-
3
-
4
-
5
-
6
-
7
-
8
-
9
-
10
-
11
-
12
-
13
-
14
-
15
-
16
-
17
-
18
-
19
-
20
-
21
-
22
-
23
-
24
-
25
-
26
-
27
-
28
-
29
-
30
-
31
-
32
-
33
-
34
-
35
-
36
-
37
-
38
-
39
-
40
-
41
-
42
-
43
-
44
-
45
-
46
-
47
-
48
-
49
-
50
-
51
-
 52
52 -
 53
53 -
 54
54 -
 55
55 -
 56
56 -
 57
57 -
 58
58 -
 59
59 -
 60
60 -
 61
61 -
 62
62 -
 63
63 -
 64
64 -
 65
65 -
 66
66 -
 67
67 -
 68
68 -
 69
69 -
 70
70 -
 71
71 -
 72
72 -
73
-
74
-
75
-
76
-
77
-
78
-
79
-
80
-
81
-
82
-
83
-
84
-
85
-
86
-
87
-
88
-
89
-
90
-
91
-
92
-
93
-
94
-
95
-
96
-
97
-
98
-
99
-
100
-
101
-
102
-
103
-
104
-
105
-
106
-
107
-
108
-
109
-
110
-
111
-
112
-
113
-
114
-
115
-
116
-
117
-
118
-
119
-
120
-
121
-
122
-
123
-
124
-
125
-
126
-
127
-
128
-
129
-
130
-
131
-
132
-
133
-
134
-
135
-
136
-
137
-
138
-
139
-
140
-
141
-
142
-
143
-
144
-
145
-
146
-
147
-
148
-
149
-
150
-
151
-
152
-
153
-
154
-
155
-
156
-
157
-
158
-
159
-
160
-
161
-
162
-
163
-
164
-
165
-
166
-
167
-
168
-
169
-
170
-
171
-
172
-
173
-
174
-
175
-
176
-
177
-
178
-
179
-
180
-
181
-
182
-
183
-
184
-
185
-
186
-
187
-
188
-
189
-
190
-
191
-
192
-
193
-
194
-
195
-
196
-
197
-
198
-
199
-
200
-
201
-
202
-
203
-
204
-
205
 |
 |

Table of Contents
scheduled payments of principal on, to pay interest on, or to refinance our debt and to satisfy our other debt obligations will depend on our future operating
performance, which will be affected by general economic, financial and other factors beyond our control. We are currently in compliance with our debt
covenant reporting and compliance obligations under the Revolving Credit Facility.
On February 7, 2011, we announced that we intend to enter into, subject to market and other conditions, the Refinancing. We currently expect to use the
proceeds from the Refinancing, if consummated, to, among other things, refinance our existing indebtedness. We currently expect to consummate the
Refinancing in March 2011; however, there can be no assurance that we will complete the Refinancing either on terms acceptable to us or at all. See "Cash
Used in Financing Activities — Proposed Refinancing".
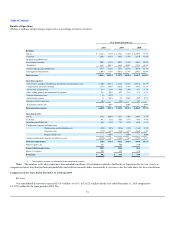
Cash Provided by Operating Activities
Cash provided by operating activities was $141.7 million, $114.0 million, and $77.4 million during the years ended December 31, 2010, 2009 and 2008
respectively. The changes between each of the periods were primarily due to changes in net income and in working capital accounts. Net income increased
$28.6 million for the year ended December 31, 2010 compared to the same period in 2009. Net income increased $14.8 million for the year ended
December 31, 2009 compared to the same period in 2008.
For the year ended December 31, 2010, inventory increased $26.2 million compared to the same period in 2009 as a result of increases in our finished
goods and a decrease in our reserves. Accounts receivable increased $10.1 million, primarily due to increased sales to franchisees. Accrued liabilities
increased by $9.2 million, primarily due to increased deferred revenue.
For the year ended December 31, 2009, inventory increased $15.7 million compared to the same period in 2008 as a result of increases in our finished
goods and a decrease in our reserves. Accounts payable decreased $28.1 million, primarily due to the timing of disbursements. Accrued liabilities increased
by $0.8 million, primarily due to increased deferred revenue.
For the year ended December 31, 2008, inventory increased $48.2 million compared to the same period in 2007 as a result of increases in our finished
goods and work in process inventories. Accounts payable increased $22.0 million, primarily due to of increases in inventory. Accrued liabilities decreased by
$16.1 million, primarily due to of decreases in accrued payroll related to the timing of the pay with year end.
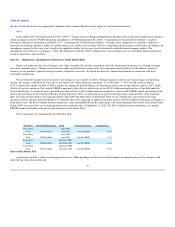
Cash Used in Investing Activities
We used cash from investing activities of $36.1 million, $42.2 million, and $60.4 million for the years ended December 31, 2010, 2009 and 2008,
respectively. We used cash of $3.1 million, $11.3 million and $10.8 million for the years ended December 31, 2010, 2009 and 2008, respectively, related to
payments to former stockholders in connection with the Merger. Capital expenditures, which were primarily for improvements to our retail stores and our
South Carolina manufacturing facility and which represent the majority of our remaining cash used in investing activities, were $32.5 million, $28.7 million,
and $48.7 million for the years ended December 31, 2010, 2009 and 2008, respectively. In 2008, we invested $1.0 million in the purchase of certain intangible
assets from a third party.
Our capital expenditures typically consist of certain periodic updates in our company-owned stores and ongoing upgrades and improvements to our
manufacturing facilities.
In each of 2011 and 2012, we expect our capital expenditures to range between $40 and $50 million, which includes costs associated with growing our
domestic square footage. We
58