GNC 2011 Annual Report Download - page 9
Download and view the complete annual report
Please find page 9 of the 2011 GNC annual report below. You can navigate through the pages in the report by either clicking on the pages listed below, or by using the keyword search tool below to find specific information within the annual report.-
 1
1 -
 2
2 -
 3
3 -
 4
4 -
 5
5 -
 6
6 -
 7
7 -
 8
8 -
 9
9 -
 10
10 -
 11
11 -
 12
12 -
 13
13 -
 14
14 -
 15
15 -
 16
16 -
 17
17 -
 18
18 -
 19
19 -
 20
20 -
21
-
22
-
23
-
24
-
25
-
26
-
27
-
28
-
29
-
30
-
31
-
32
-
33
-
34
-
35
-
36
-
37
-
38
-
39
-
40
-
41
-
42
-
43
-
44
-
45
-
46
-
47
-
48
-
49
-
50
-
51
-
52
-
53
-
54
-
55
-
56
-
57
-
58
-
59
-
60
-
61
-
62
-
63
-
64
-
65
-
66
-
67
-
68
-
69
-
70
-
71
-
72
-
73
-
74
-
75
-
76
-
77
-
78
-
79
-
80
-
81
-
82
-
83
-
84
-
85
-
86
-
87
-
88
-
89
-
90
-
91
-
92
-
93
-
94
-
95
-
96
-
97
-
98
-
99
-
100
-
101
-
102
-
103
-
104
-
105
-
106
-
107
-
108
-
109
-
110
-
111
-
112
-
113
-
114
-
115
-
116
-
117
-
118
-
119
-
120
-
121
-
122
-
123
-
124
-
125
-
126
-
127
-
128
-
129
-
130
-
131
-
132
-
133
-
134
-
135
-
136
-
137
-
138
-
139
-
140
-
141
-
142
-
143
-
144
-
145
-
146
-
147
-
148
-
149
-
150
-
151
-
152
-
153
-
154
-
155
-
156
-
157
-
158
-
159
-
160
-
161
-
162
-
163
-
164
-
165
-
166
-
167
-
168
-
169
-
170
-
171
-
172
-
173
-
174
-
175
-
176
-
177
-
178
-
179
-
180
-
181
-
182
-
183
-
184
-
185
-
186
-
187
-
188
-
189
-
190
-
191
-
192
-
193
-
194
-
195
-
196
-
197
-
198
-
199
-
200
-
201
-
202
-
203
-
204
-
205
 |
 |

Table of Contents
2009, up from 15% in 2008. We believe that growth in our industry will continue to be driven by consumers who increasingly embrace health and
wellness as an important part of their lifestyles.
Participants in our industry include specialty retailers, supermarkets, drugstores, mass merchants, multi-level marketing organizations, online retailers,
mail-order companies and a variety of other smaller participants. The nutritional supplements sold through these channels are divided into four major product
categories: VMHS; sports nutrition products; diet products; and other wellness products. Most supermarkets, drugstores and mass merchants have narrow
nutritional supplement product offerings limited primarily to simple vitamins and herbs, with less knowledgeable sales associates than specialty retailers. We
believe that the market share of supermarkets, drugstores and mass merchants over the last five years has remained relatively constant.
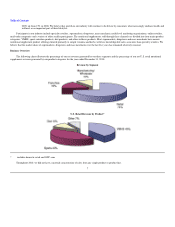
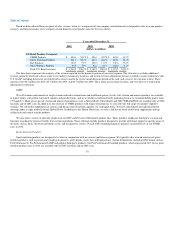
Business Overview
The following charts illustrate the percentage of our net revenue generated by our three segments and the percentage of our net U.S. retail nutritional
supplements revenue generated by our product categories for the year ended December 31, 2010:
Revenue by Segment
U.S. Retail Revenue by Product*
includes domestic retail and GNC.com
Throughout 2010, we did not have a material concentration of sales from any single product or product line.
7
*