GNC 2011 Annual Report Download - page 57
Download and view the complete annual report
Please find page 57 of the 2011 GNC annual report below. You can navigate through the pages in the report by either clicking on the pages listed below, or by using the keyword search tool below to find specific information within the annual report.-
 1
1 -
2
-
3
-
4
-
5
-
6
-
7
-
8
-
9
-
10
-
11
-
12
-
13
-
14
-
15
-
16
-
17
-
18
-
19
-
20
-
21
-
22
-
23
-
24
-
25
-
26
-
27
-
28
-
29
-
30
-
31
-
32
-
33
-
34
-
35
-
36
-
37
-
38
-
39
-
40
-
41
-
42
-
43
-
44
-
45
-
46
-
 47
47 -
 48
48 -
 49
49 -
 50
50 -
 51
51 -
 52
52 -
 53
53 -
 54
54 -
 55
55 -
 56
56 -
 57
57 -
 58
58 -
 59
59 -
 60
60 -
 61
61 -
 62
62 -
 63
63 -
 64
64 -
 65
65 -
 66
66 -
 67
67 -
68
-
69
-
70
-
71
-
72
-
73
-
74
-
75
-
76
-
77
-
78
-
79
-
80
-
81
-
82
-
83
-
84
-
85
-
86
-
87
-
88
-
89
-
90
-
91
-
92
-
93
-
94
-
95
-
96
-
97
-
98
-
99
-
100
-
101
-
102
-
103
-
104
-
105
-
106
-
107
-
108
-
109
-
110
-
111
-
112
-
113
-
114
-
115
-
116
-
117
-
118
-
119
-
120
-
121
-
122
-
123
-
124
-
125
-
126
-
127
-
128
-
129
-
130
-
131
-
132
-
133
-
134
-
135
-
136
-
137
-
138
-
139
-
140
-
141
-
142
-
143
-
144
-
145
-
146
-
147
-
148
-
149
-
150
-
151
-
152
-
153
-
154
-
155
-
156
-
157
-
158
-
159
-
160
-
161
-
162
-
163
-
164
-
165
-
166
-
167
-
168
-
169
-
170
-
171
-
172
-
173
-
174
-
175
-
176
-
177
-
178
-
179
-
180
-
181
-
182
-
183
-
184
-
185
-
186
-
187
-
188
-
189
-
190
-
191
-
192
-
193
-
194
-
195
-
196
-
197
-
198
-
199
-
200
-
201
-
202
-
203
-
204
-
205
 |
 |

Table of Contents
the same period in 2009. These expenses, as a percentage of net revenue, were 23.5% for the year ended December 31, 2010 compared to 24.0% for the year
ended December 31, 2009.
Compensation and related benefits. Compensation and related benefits increased $10.6 million, or 4.0%, to $273.6 million for the year ended
December 31, 2010 compared to $263.0 million for the same period in 2009. The increase was due to increases of: (1) $8.9 million in base wages and related
payroll taxes to support our increased store base and sales volume and to comply with the increases in minimum wage rates; (2) $1.0 million in health
insurance costs; and (3) $0.7 million in other compensation expenses.
Advertising and promotion. Advertising and promotion expenses increased $1.4 million, or 2.7%, to $51.4 million for the year ended December 31,
2010 compared to $50.0 million during the same period in 2009. Advertising expense increased primarily as a result of increases in media and production
costs of $1.4 million, in store signage costs of $1.3 million, and other advertising costs of $0.6 million, partially offset by decreases in print advertising costs
of $1.9 million.
Other SG&A. Other SG&A expenses, including amortization expense, increased $3.1 million, or 3.3%, to $99.6 million for the year ended
December 31, 2010 compared to $96.5 million for the year ended December 31, 2009. Increases in other SG&A expenses included telecom expense of
$1.1 million, commissions of $2.1 million, credit card fees of $1.6 million, and other expense of $2.0 million. These were partially offset by decreases in
amortization and depreciation expense of $3.0 million and bad debt expense of $0.7 million.
Strategic alternative costs. In addition to the above, we incurred $3.5 million of non-recurring expenses, principally related to the exploration of
strategic alternatives.
Foreign Currency (Gain) Loss
Foreign currency (gain) loss for the years ended December 31, 2010 and 2009 resulted primarily from accounts payable activity with our Canadian
subsidiary. We recognized income of $0.3 million and $0.1 million for the years ended December 31, 2010 and 2009, respectively.
Operating Income
As a result of the foregoing, consolidated operating income increased $33.4 million, or 18.4%, to $214.6 million for the year ended December 31, 2010
compared to $181.2 million for the same period in 2009. Operating income, as a percentage of net revenue, was 11.8% and 10.6% for the years ended
December 31, 2010 and 2009, respectively.
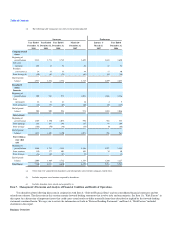
Retail. Operating income increased $28.8 million, or 18.8%, to $181.9 million for the year ended December 31, 2010 compared to $153.1 million for
the same period in 2009. The increase was primarily the result of higher dollar margins on increased sales volumes offset by increases in occupancy costs,
compensation costs and other SG&A expenses.
Franchise. Operating income increased $14.5 million, or 17.9%, to $95.3 million for the year ended December 31, 2010 compared to $80.8 million
for the same period in 2009. This increase was due to increases in royalty income, franchise fees, higher dollar margins on increased product sales to
franchisees and reductions in bad debt expenses and amortization expense.
Manufacturing/Wholesale. Operating income decreased $4.1 million, or 5.5%, to $69.4 million for the year ended December 31, 2010 compared to
$73.5 million for the same period in 2009. This decrease was primarily the result of lower dollar margins on decreased sales volumes from our South Carolina
manufacturing facility.
53