GNC 2011 Annual Report Download - page 147
Download and view the complete annual report
Please find page 147 of the 2011 GNC annual report below. You can navigate through the pages in the report by either clicking on the pages listed below, or by using the keyword search tool below to find specific information within the annual report.-
 1
1 -
2
-
3
-
4
-
5
-
6
-
7
-
8
-
9
-
10
-
11
-
12
-
13
-
14
-
15
-
16
-
17
-
18
-
19
-
20
-
21
-
22
-
23
-
24
-
25
-
26
-
27
-
28
-
29
-
30
-
31
-
32
-
33
-
34
-
35
-
36
-
37
-
38
-
39
-
40
-
41
-
42
-
43
-
44
-
45
-
46
-
47
-
48
-
49
-
50
-
51
-
52
-
53
-
54
-
55
-
56
-
57
-
58
-
59
-
60
-
61
-
62
-
63
-
64
-
65
-
66
-
67
-
68
-
69
-
70
-
71
-
72
-
73
-
74
-
75
-
76
-
77
-
78
-
79
-
80
-
81
-
82
-
83
-
84
-
85
-
86
-
87
-
88
-
89
-
90
-
91
-
92
-
93
-
94
-
95
-
96
-
97
-
98
-
99
-
100
-
101
-
102
-
103
-
104
-
105
-
106
-
107
-
108
-
109
-
110
-
111
-
112
-
113
-
114
-
115
-
116
-
117
-
118
-
119
-
120
-
121
-
122
-
123
-
124
-
125
-
126
-
127
-
128
-
129
-
130
-
131
-
132
-
133
-
134
-
135
-
136
-
 137
137 -
 138
138 -
 139
139 -
 140
140 -
 141
141 -
 142
142 -
 143
143 -
 144
144 -
 145
145 -
 146
146 -
 147
147 -
 148
148 -
 149
149 -
 150
150 -
 151
151 -
 152
152 -
 153
153 -
 154
154 -
 155
155 -
 156
156 -
 157
157 -
158
-
159
-
160
-
161
-
162
-
163
-
164
-
165
-
166
-
167
-
168
-
169
-
170
-
171
-
172
-
173
-
174
-
175
-
176
-
177
-
178
-
179
-
180
-
181
-
182
-
183
-
184
-
185
-
186
-
187
-
188
-
189
-
190
-
191
-
192
-
193
-
194
-
195
-
196
-
197
-
198
-
199
-
200
-
201
-
202
-
203
-
204
-
205
 |
 |

Table of Contents
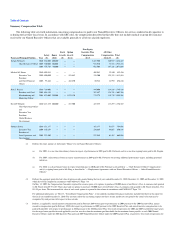
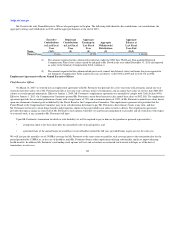
Grants of Plan-Based Awards
The following table sets forth information concerning awards under our non-equity incentive plans granted to each of our Named Executive Officers
during the fiscal year ended December 31, 2010. Assumptions used in the calculation of certain dollar amounts are included in Note 18, "Stock-Based
Compensation Plans", to our audited consolidated financial statements included elsewhere in this report.
All Other
Option
Awards:
Number of
Securities
Underlying
Options
(#)
Estimated Possible Payouts
under Non-equity Incentive Plan Awards(1)
Exercise
or Base
Price of
Option
Awards
($/Sh)
Grant Date
Fair Value
of Stock
and Option
Awards
($)
Name Grant Date
Threshold #1
($)
Threshold #2
($)
Target
($)
Maximum
($)
Joseph
Fortunato — 219,285 438,570 664,500 1,107,500 — — —
Michael M.
Nuzzo — 60,877 121,753 184,474 409,943 — — —
Beth J.
Kaplan — 177,210 354,420 537,000 895,000 — — —
David P.
Berg
May 13,
2010 — — — — 125,000(2) 10.09 287,500(3)
— 63,541 112,082 192,548 427,885 — — —
Thomas
Dowd — 52,150 104,300 158,030 351,177 — — —
The amounts represent the threshold, target and maximum potential amounts that might have been payable based on the targets approved for our Named Executive
Officers under the 2010 Incentive Plan. See "— How We Chose Amounts and/or Formulas for Each Element" for more information regarding the thresholds under
the 2010 Incentive Plan.
Time-based stock option awards made under the 2007 Stock Plan, which awards vest subject to continuing employment in five equal annual installments
commencing on the first anniversary of the date of grant.
Reflects the aggregate grant date fair value of the award computed in accordance with FASB ASC Topic 718. For additional information, see Note 18, "Stock-Based
Compensation Plans", to our consolidated financial statements included elsewhere in this report. The amounts reflect the accounting expense for these awards and
do not correspond to actual value that may be recognized by such persons with respect to these awards. The grant date fair value was $2.30 per share, calculated in
accordance with FASB ASC Topic 718.
(1)
(2)
(3)
140