GNC 2011 Annual Report Download - page 76
Download and view the complete annual report
Please find page 76 of the 2011 GNC annual report below. You can navigate through the pages in the report by either clicking on the pages listed below, or by using the keyword search tool below to find specific information within the annual report.-
 1
1 -
2
-
3
-
4
-
5
-
6
-
7
-
8
-
9
-
10
-
11
-
12
-
13
-
14
-
15
-
16
-
17
-
18
-
19
-
20
-
21
-
22
-
23
-
24
-
25
-
26
-
27
-
28
-
29
-
30
-
31
-
32
-
33
-
34
-
35
-
36
-
37
-
38
-
39
-
40
-
41
-
42
-
43
-
44
-
45
-
46
-
47
-
48
-
49
-
50
-
51
-
52
-
53
-
54
-
55
-
56
-
57
-
58
-
59
-
60
-
61
-
62
-
63
-
64
-
65
-
 66
66 -
 67
67 -
 68
68 -
 69
69 -
 70
70 -
 71
71 -
 72
72 -
 73
73 -
 74
74 -
 75
75 -
 76
76 -
 77
77 -
 78
78 -
 79
79 -
 80
80 -
 81
81 -
 82
82 -
 83
83 -
 84
84 -
 85
85 -
 86
86 -
87
-
88
-
89
-
90
-
91
-
92
-
93
-
94
-
95
-
96
-
97
-
98
-
99
-
100
-
101
-
102
-
103
-
104
-
105
-
106
-
107
-
108
-
109
-
110
-
111
-
112
-
113
-
114
-
115
-
116
-
117
-
118
-
119
-
120
-
121
-
122
-
123
-
124
-
125
-
126
-
127
-
128
-
129
-
130
-
131
-
132
-
133
-
134
-
135
-
136
-
137
-
138
-
139
-
140
-
141
-
142
-
143
-
144
-
145
-
146
-
147
-
148
-
149
-
150
-
151
-
152
-
153
-
154
-
155
-
156
-
157
-
158
-
159
-
160
-
161
-
162
-
163
-
164
-
165
-
166
-
167
-
168
-
169
-
170
-
171
-
172
-
173
-
174
-
175
-
176
-
177
-
178
-
179
-
180
-
181
-
182
-
183
-
184
-
185
-
186
-
187
-
188
-
189
-
190
-
191
-
192
-
193
-
194
-
195
-
196
-
197
-
198
-
199
-
200
-
201
-
202
-
203
-
204
-
205
 |
 |

Table of Contents
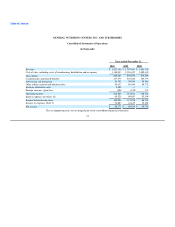
GENERAL NUTRITION CENTERS, INC. AND SUBSIDIARIES
Consolidated Statements of Operations
(in thousands)
Year ended December 31,
2010 2009 2008
Revenue $ 1,822,396 $ 1,707,007 $ 1,656,729
Cost of sales, including costs of warehousing, distribution and occupancy 1,180,033 1,116,437 1,082,630
Gross profit 642,363 590,570 574,099
Compensation and related benefits 273,579 263,046 249,793
Advertising and promotion 51,392 50,034 55,060
Other selling, general and administrative 99,623 96,454 98,732
Strategic alternative costs 3,480 — —
Foreign currency (gain) loss (296) (155) 733
Operating income 214,585 181,191 169,781
Interest expense, net (Note 12) 65,529 69,953 83,000
Income before income taxes 149,056 111,238 86,781
Income tax expense (Note 5) 50,883 41,619 32,001
Net income $ 98,173 $ 69,619 $ 54,780
The accompanying notes are an integral part of the consolidated financial statements.
72