GNC 2011 Annual Report Download - page 113
Download and view the complete annual report
Please find page 113 of the 2011 GNC annual report below. You can navigate through the pages in the report by either clicking on the pages listed below, or by using the keyword search tool below to find specific information within the annual report.-
 1
1 -
2
-
3
-
4
-
5
-
6
-
7
-
8
-
9
-
10
-
11
-
12
-
13
-
14
-
15
-
16
-
17
-
18
-
19
-
20
-
21
-
22
-
23
-
24
-
25
-
26
-
27
-
28
-
29
-
30
-
31
-
32
-
33
-
34
-
35
-
36
-
37
-
38
-
39
-
40
-
41
-
42
-
43
-
44
-
45
-
46
-
47
-
48
-
49
-
50
-
51
-
52
-
53
-
54
-
55
-
56
-
57
-
58
-
59
-
60
-
61
-
62
-
63
-
64
-
65
-
66
-
67
-
68
-
69
-
70
-
71
-
72
-
73
-
74
-
75
-
76
-
77
-
78
-
79
-
80
-
81
-
82
-
83
-
84
-
85
-
86
-
87
-
88
-
89
-
90
-
91
-
92
-
93
-
94
-
95
-
96
-
97
-
98
-
99
-
100
-
101
-
102
-
 103
103 -
 104
104 -
 105
105 -
 106
106 -
 107
107 -
 108
108 -
 109
109 -
 110
110 -
 111
111 -
 112
112 -
 113
113 -
 114
114 -
 115
115 -
 116
116 -
 117
117 -
 118
118 -
 119
119 -
 120
120 -
 121
121 -
 122
122 -
 123
123 -
124
-
125
-
126
-
127
-
128
-
129
-
130
-
131
-
132
-
133
-
134
-
135
-
136
-
137
-
138
-
139
-
140
-
141
-
142
-
143
-
144
-
145
-
146
-
147
-
148
-
149
-
150
-
151
-
152
-
153
-
154
-
155
-
156
-
157
-
158
-
159
-
160
-
161
-
162
-
163
-
164
-
165
-
166
-
167
-
168
-
169
-
170
-
171
-
172
-
173
-
174
-
175
-
176
-
177
-
178
-
179
-
180
-
181
-
182
-
183
-
184
-
185
-
186
-
187
-
188
-
189
-
190
-
191
-
192
-
193
-
194
-
195
-
196
-
197
-
198
-
199
-
200
-
201
-
202
-
203
-
204
-
205
 |
 |
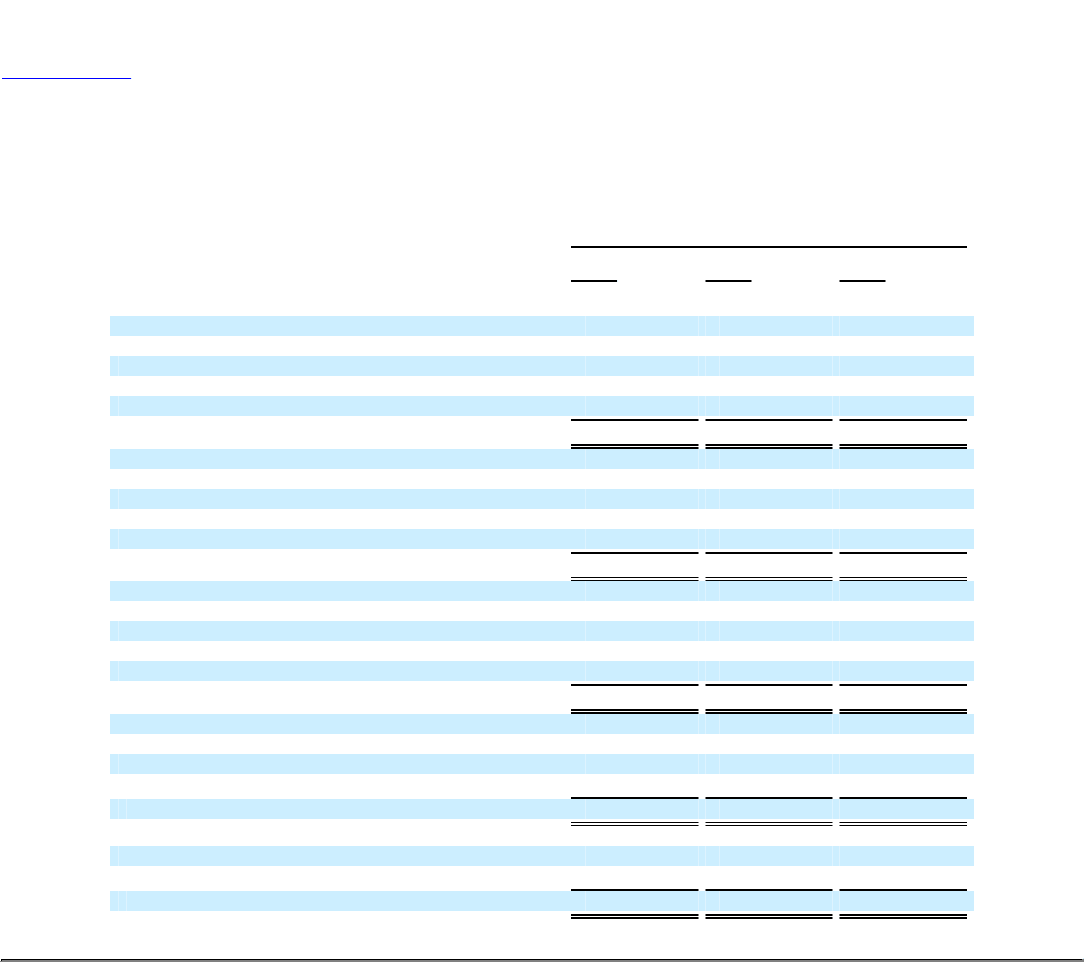
Table of Contents
NOTE 19. SEGMENTS (Continued)
December 31,
2010 2009 2008
(in thousands)
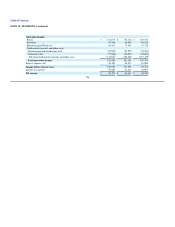
Depreciation and amortization:
Retail $ 26,241 $ 24,164 $ 21,449
Franchise 3,044 4,081 5,001
Manufacturing / Wholesale 11,407 10,926 9,783
Corporate / Other 6,301 7,494 6,220
Total depreciation and amortization $ 46,993 $ 46,665 $ 42,453
Capital expenditures:
Retail $ 23,263 $ 20,640 $ 33,074
Franchise 50 2 7
Manufacturing / Wholesale 4,318 4,527 11,108
Corporate / Other 4,891 3,513 4,477
Total capital expenditures $ 32,522 $ 28,682 $ 48,666
Total assets
Retail $ 1,272,541 $ 1,259,024 $ 1,263,229
Franchise 477,643 470,277 471,247
Manufacturing / Wholesale 410,832 416,523 436,018
Corporate / Other 221,459 157,778 121,514
Total assets $ 2,382,475 $ 2,303,602 $ 2,292,008
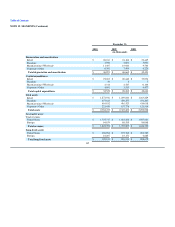
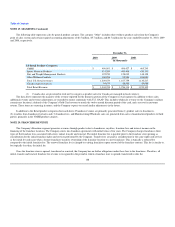
Geographic areas
Total revenues:
United States $ 1,727,717 $ 1,618,452 $ 1,567,641
Foreign 94,679 88,555 89,088
Total revenues $ 1,822,396 $ 1,707,007 $ 1,656,729
Long-lived assets:
United States $ 188,988 $ 193,762 $ 201,787
Foreign 10,207 10,151 6,885
Total long-lived assets $ 199,195 $ 203,913 $ 208,672
107