GNC 2011 Annual Report Download - page 61
Download and view the complete annual report
Please find page 61 of the 2011 GNC annual report below. You can navigate through the pages in the report by either clicking on the pages listed below, or by using the keyword search tool below to find specific information within the annual report.-
 1
1 -
2
-
3
-
4
-
5
-
6
-
7
-
8
-
9
-
10
-
11
-
12
-
13
-
14
-
15
-
16
-
17
-
18
-
19
-
20
-
21
-
22
-
23
-
24
-
25
-
26
-
27
-
28
-
29
-
30
-
31
-
32
-
33
-
34
-
35
-
36
-
37
-
38
-
39
-
40
-
41
-
42
-
43
-
44
-
45
-
46
-
47
-
48
-
49
-
50
-
 51
51 -
 52
52 -
 53
53 -
 54
54 -
 55
55 -
 56
56 -
 57
57 -
 58
58 -
 59
59 -
 60
60 -
 61
61 -
 62
62 -
 63
63 -
 64
64 -
 65
65 -
 66
66 -
 67
67 -
 68
68 -
 69
69 -
 70
70 -
 71
71 -
72
-
73
-
74
-
75
-
76
-
77
-
78
-
79
-
80
-
81
-
82
-
83
-
84
-
85
-
86
-
87
-
88
-
89
-
90
-
91
-
92
-
93
-
94
-
95
-
96
-
97
-
98
-
99
-
100
-
101
-
102
-
103
-
104
-
105
-
106
-
107
-
108
-
109
-
110
-
111
-
112
-
113
-
114
-
115
-
116
-
117
-
118
-
119
-
120
-
121
-
122
-
123
-
124
-
125
-
126
-
127
-
128
-
129
-
130
-
131
-
132
-
133
-
134
-
135
-
136
-
137
-
138
-
139
-
140
-
141
-
142
-
143
-
144
-
145
-
146
-
147
-
148
-
149
-
150
-
151
-
152
-
153
-
154
-
155
-
156
-
157
-
158
-
159
-
160
-
161
-
162
-
163
-
164
-
165
-
166
-
167
-
168
-
169
-
170
-
171
-
172
-
173
-
174
-
175
-
176
-
177
-
178
-
179
-
180
-
181
-
182
-
183
-
184
-
185
-
186
-
187
-
188
-
189
-
190
-
191
-
192
-
193
-
194
-
195
-
196
-
197
-
198
-
199
-
200
-
201
-
202
-
203
-
204
-
205
 |
 |

Table of Contents
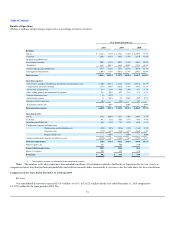
increase was primarily due to an increase in compensation expense and professional fees in 2009. In addition, compensation expenses for the year ended
December 31, 2008 included a $1.1 million reduction due to a change in our vacation policy effective March 31, 2008.
Interest Expense
Interest expense decreased $13.0 million, or 15.7%, to $70.0 million for the year ended December 31, 2009 compared to $83.0 million for the same
period in 2008. This decrease was primarily attributable to decreases in interest rates on our variable rate debt in 2009 compared to 2008 and $25.3 million in
principal payments during 2009.
Income Tax Expense
We recognized $41.6 million of income tax expense (or 37.4% of pre-tax income) during the year ended December 31, 2009 compared to $32.0 million
(or 36.9% of pre-tax income) for the same period in 2008. For the year ended December 31, 2009, a $0.5 million discrete tax benefit was recorded, while a
$2.0 million discrete tax benefit was recorded for the year ended December 31, 2008.
Net Income
As a result of the foregoing, consolidated net income increased $14.8 million to $69.6 million for the year ended December 31, 2009 compared to
$54.8 million for the same period in 2008.
Liquidity and Capital Resources
At December 31, 2010, we had $150.6 million in cash and cash equivalents and $443.0 million in working capital compared to $75.1 million in cash
and cash equivalents and $382.6 million in working capital at December 31, 2009. The $60.4 million increase in our working capital was driven by increases
in our inventory, accounts receivable, and cash and a decrease in our accrued interest. This was offset by increases in our current portion of long-term debt
and accrued payroll and related liabilities.
At December 31, 2009, we had $75.1 million in cash and cash equivalents and $382.6 million in working capital compared to $42.3 million in cash and
cash equivalents and $305.1 million in working capital at December 31, 2008. The $77.5 million increase in our working capital was driven by increases in
our inventory and cash and a decrease in our accrued interest, accounts payable and current portion of long-term debt. This was partially offset by a decrease
in our deferred taxes.
We expect to fund our operations through internally generated cash and, if necessary, from borrowings under the Revolving Credit Facility. At
December 31, 2010, we had $44.9 million available under the Revolving Credit Facility, after giving effect to $8.8 million utilized to secure letters of credit
and a $6.3 million commitment Lehman that we do not expect Lehman will fund.
We expect that our primary uses of cash in the near future will be for the purposes of fulfilling debt service requirements, capital expenditures and
working capital requirements. In March 2010 and July 2009, our board of directors declared $28.4 million and $13.6 million, respectively, of dividends to
GNC Corporation with payment dates of March 23, 2010 and August 30, 2009, respectively. Holdings was the final recipient of this dividend. The dividends
were paid with cash generated from operations.
We currently anticipate that cash generated from operations, together with amounts available under the Revolving Credit Facility (excluding Lehman's
commitment), will be sufficient for the term of the facility, which matures on March 15, 2012, to meet our operating expenses, capital expenditures and debt
service obligations as they become due. However, our ability to make
57