GNC 2011 Annual Report Download - page 136
Download and view the complete annual report
Please find page 136 of the 2011 GNC annual report below. You can navigate through the pages in the report by either clicking on the pages listed below, or by using the keyword search tool below to find specific information within the annual report.-
 1
1 -
2
-
3
-
4
-
5
-
6
-
7
-
8
-
9
-
10
-
11
-
12
-
13
-
14
-
15
-
16
-
17
-
18
-
19
-
20
-
21
-
22
-
23
-
24
-
25
-
26
-
27
-
28
-
29
-
30
-
31
-
32
-
33
-
34
-
35
-
36
-
37
-
38
-
39
-
40
-
41
-
42
-
43
-
44
-
45
-
46
-
47
-
48
-
49
-
50
-
51
-
52
-
53
-
54
-
55
-
56
-
57
-
58
-
59
-
60
-
61
-
62
-
63
-
64
-
65
-
66
-
67
-
68
-
69
-
70
-
71
-
72
-
73
-
74
-
75
-
76
-
77
-
78
-
79
-
80
-
81
-
82
-
83
-
84
-
85
-
86
-
87
-
88
-
89
-
90
-
91
-
92
-
93
-
94
-
95
-
96
-
97
-
98
-
99
-
100
-
101
-
102
-
103
-
104
-
105
-
106
-
107
-
108
-
109
-
110
-
111
-
112
-
113
-
114
-
115
-
116
-
117
-
118
-
119
-
120
-
121
-
122
-
123
-
124
-
125
-
 126
126 -
 127
127 -
 128
128 -
 129
129 -
 130
130 -
 131
131 -
 132
132 -
 133
133 -
 134
134 -
 135
135 -
 136
136 -
 137
137 -
 138
138 -
 139
139 -
 140
140 -
 141
141 -
 142
142 -
 143
143 -
 144
144 -
 145
145 -
 146
146 -
147
-
148
-
149
-
150
-
151
-
152
-
153
-
154
-
155
-
156
-
157
-
158
-
159
-
160
-
161
-
162
-
163
-
164
-
165
-
166
-
167
-
168
-
169
-
170
-
171
-
172
-
173
-
174
-
175
-
176
-
177
-
178
-
179
-
180
-
181
-
182
-
183
-
184
-
185
-
186
-
187
-
188
-
189
-
190
-
191
-
192
-
193
-
194
-
195
-
196
-
197
-
198
-
199
-
200
-
201
-
202
-
203
-
204
-
205
 |
 |

Table of Contents
salary and other short-term compensation data, including incentive compensation and fringe benefits, that are available from Mercer Human Resource
Consulting LLC, Western Management Group and Watson Wyatt Worldwide in the specialty retail and non-durable manufacturing categories. In addition to
focusing our analysis on the specific executive positions, we break down the survey information based on corporate and/or average store revenue and
geographic location of comparable companies to ensure that we are using valid comparisons. We also use internal value comparisons; however, we do not
have any specific point system or rating structure for internal values.
We have not historically used, and do not currently intend to use, the information in the surveys for benchmarking purposes or in our process for setting
compensation. Rather, the Compensation Committee sets compensation levels and then uses the information in the surveys to confirm and demonstrate to
management that the compensation being paid by us is consistent with market levels.
Effective January 1, 2011, the Compensation Committee granted merit-based increases to the annual base salaries of each of our Named Executive
Officers based upon their performance for the year ended December 31, 2010. The increase for each Named Executive Officer was 3.0% as a percentage of
his or her previous annual base salary. The annual base salaries of Mr. Fortunato, Mr. Nuzzo, Ms. Kaplan, Mr. Dowd and Mr. Berg were increased to
$912,580, $421,682, $737,480, $360,500 and $463,500, respectively.
In awarding a uniform increase to the Named Executive Officers, the Compensation Committee recognized the joint contributions of each of the Named
Executive Officers and their respective teams to our overall financial performance. In determining salary adjustments for executive officers, where
appropriate, the Compensation Committee has historically considered, and may in the future consider, non-financial performance measures such as efficiency
improvements and the enhancement of relations with our customers, vendors and employees, after taking into account individual responsibilities, performance
and experience.
Annual Incentive Compensation. Our Named Executive Officers are entitled to annual performance bonuses pursuant to the terms of their
employment agreements. The annual performance bonus for each Named Executive Officer has target and maximum bonus amounts expressed as a
percentage of his or her annual base salary. The respective percentages are determined by position and level of responsibility and are stated in the annual
incentive plan adopted by the Compensation Committee. The employment agreements of our Chief Executive Officer and President provide that their targets
will not be less than 75% of their respective base salaries with a maximum of 125% of their respective base salaries. The target and/or maximum amounts
may be increased for any Named Executive Officer by the terms of an employment agreement entered into after the adoption of an annual incentive plan.
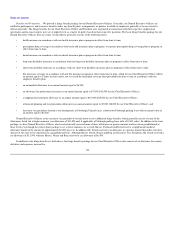
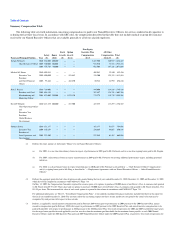
The following table sets forth the target and maximum bonus amounts for each level of executive officer with respect to the 2010 incentive plan
adopted in February 2010 (the "2010 Incentive Plan"), the 2009 incentive plan adopted in February 2009 (the "2009 Incentive Plan"), and the 2008 incentive
plan adopted in February 2008 (the "2008 Incentive Plan"):
2010 Incentive Plan 2009 Incentive Plan 2008 Incentive Plan
Target Amount Maximum Amount Target Amount Maximum Amount Target Amount Maximum Amount
75% 125% 75% 125% 75% 125%
President 75% 125% 75% 125% 75% 125%
Executive
President 45% 100% 45% 100% 45% 100%
Senior Vice
President 40% 75% 40% 75% 40% 75%
130